- Software
- Open access
- Published:
The VI-Suite: a set of environmental analysis tools with geospatial data applications
Open Geospatial Data, Software and Standards volume 2, Article number: 23 (2017)
Abstract
Background
The VI-Suite is a free and open-source addon for the 3D content creation application Blender, developed primarily as a tool for the contextual and performative analysis of buildings. Its functionality has grown from simple, static lighting analysis to fully parametric lighting, shadowing, and building energy analyses. It adopts a flexible, mesh geometry based approach to the specification of calculation points and this has made it suitable for certain types of 3D geospatial analyses and data visualisation.
Results
As this is the first academic paper to discuss the VI-Suite, a history of its development is presented along with a review of its capabilities of relevance to geospatial analysis. As the VI-Suite combines the functionality of 3D design software with performance simulation, some of the benefits of this combination are discussed including aspects that make it suitable for the processing and analysis of potentially large geospatial datasets. Example use cases with a 3D city model of the Hague are used to demonstrate some of the geospatial workflows possible and some of the result visualisation options.
Conclusions
The free and open-source nature of the VI-Suite, combined with the use of Blender mesh geometry to define calculation points, has encouraged usage scenarios not originally intended by the authors, for example large scale urban shadow and radiation analyses. The flexibility inherent in this mesh based approach enables the analysis of large geospatial datasets by giving the user refined control over the distribution of calculation points within the model. The integration of GIS analysis into a digital design package such as Blender offers advanced geometry/material editing and specification, provides tools such as ray casting and BVH tree generation to speed up the simulation of large datasets, and enhanced visualisation of GIS simulation data including animated city fly-throughs and high quality image production. The VI-Suite is part of a completely open-source tool chain and contributions from the community are welcome to further enhance its current geospatial data capabilities.
Introduction
This paper presents for the first time the VI-Suite, a free and open-source integrated set of building environmental performance simulation tools that encompasses functionality suitable for geospatial analysis. The VI-Suite uses the 3D content creation suite Blender as a host application to provide modelling, rendering and animation capabilities for pre/post-processing of the simulated scenarios as well as an intuitive and flexible nodal user interface for the construction of simulation pipelines.
The VI-Suite uses some of Blender’s in-built functionality to create sun paths and shadow maps, integrates the external applications Radiance and EnergyPlus to carry out lighting and energy simulations and utilises external Python libraries to visualise contextual and simulation result data [1].
Although many of these capabilities can be found in other software packages the free, multi-platform and open-source nature of the VI-Suite, and all the applications it relies on including Blender, Radiance, EnergyPlus and Python, makes the VI-Suite unique and available to anyone interested in built-environment performance with minimal hardware, platform or cost barriers. In addition, the use of an advanced 3D design tool to provide a software framework for a geospatial workflow presents some additional advantages which are discussed later in this paper.
In addition to its core architectural applications the VI-Suite has been successfully used to conduct geospatial data analysis and visualisation. This paper will focus on these capabilities and begins with a description of Blender and some of its features that make it suitable as a host application, before going on to describe the VI-Suite in terms of its aims, capabilities, and history of development.
The paper then proceeds to detail the process of creating shadow and irradiance maps before finally applying these methodologies to a geospatial dataset; in this case a 3D city model. The integration of the analysis capabilities of the VI-Suite with a comprehensive digital design package such as Blender is also shown to provide flexible and appealing result visualisations.
Background
Blender
Blender1 (Blender Foundation) is a free and open-source 3D application that aims to be a ‘Swiss-army knife’ for digital content creation. It includes a mesh-based 3D modeller, advanced materials and texture specification, animation system, a physically based renderer and a deeply integrated Python2 Application Programming Interface (API) amongst other features. Some of these features have made Blender an increasingly popular host application for a range of scientific visualisation and analysis tools [2–5] including GIS data processing3 and other GIS related visualisation applications [6–8]. These key features include:
Mesh based modelling As opposed to a surface (e.g. Rhino) or solid (e.g. Solidworks) based modeller, geometry in Blender is primarily stored as a mesh, i.e. geometry is composed of vertices, edges and faces. This allows data to be associated with, and visualised at, specific geometric points, and the distribution of those points is easily manipulated by the user. It also means Blender can natively import and export a number of common mesh based geometry formats such as OBJ and 3DS with no loss of geometric detail.
Python API Python is an open-source, high-level computing language used for Blender’s API. This Python API is deeply integrated allowing, for example, specification of data and control over mesh elements, manipulation of the Blender interface and the drawing of custom OpenGL graphical elements over the interface itself. With the Python API it is therefore possible to create custom user interfaces to control the creation and visualisation of mesh based data.
Animation System Blender’s frame based animation system can be used to visualise variant data sets and is also used by the VI-Suite to specify variant simulation contexts that enable parametric as well as static analyses.
In addition, the Blender interface is very flexible and customisable for different usage cases. This, coupled with the Python API, allows plugin (called addons in Blender) developers to create embedded custom user interface and display elements.
VI-Suite history
The features mentioned above made Blender an early choice as a host application to provide geometry and materiality creation and export for the Radiance lighting simulation suite [9]. Early examples include Brad4 and Radex.
Radiance is a set of free, multi-platform and open-source tools for the visualisation and calculation of artificial and natural lighting and radiation metrics. Radiance comes with no native user interface and consists mainly of a number of executable files, typically run from the command line. This has made the use of pure Radiance somewhat problematic for novice users and students [10]. Radiance can however accept mesh based geometry descriptions and can convert OBJ files to native Radiance geometry. The mesh based geometry format used by Blender, coupled with the ability to create custom user interfaces with the Python API, made Blender an appropriate choice to act as a Radiance frontend. In these early examples Blender acted primarily as a pre-processor i.e. a geometry/material creator and exporter that could initiate the Radiance simulation and visualise the results using Radiance’s native rendering tools.
The first component of the VI-Suite, the Lighting Visualiser (LiVi), was inspired by these early examples to embed Radiance functionality within Blender. LiVi began in 2009 as a standalone addon for Blender that would convert Blender geometry and materiality to a valid Radiance format and initiate the Radiance simulation via additions to the Blender user interface. A key difference to previous Blender/Radiance integrations was that LiVi could then post-process or import numerical results generated by Radiance back into Blender for visualisation. This was achieved by specifying Blender mesh geometry as sensing surfaces and then colouring the faces of that geometry with the Python API according to the results generated. Figure 1 shows an early LiVi simulation of instantaneous solar irradiation within a city scene. The legend is drawn over Blender’s 3D view by LiVi via the Python API.

Early VI-Suite Lighting Visualiser (LiVi) simulation
The advantage of including post-processing within the scope of the addon was that results could be navigated and visualised in-situ very quickly to encourage fast, performance based architectural design iteration.
In 2013 development began on the Energy Visualiser (EnVi) a standalone Blender addon that would act a a pre/post-processor for EnergyPlus; a free and open source application for building lighting, energy and ventilation performance analysis [11]. EnergyPlus also comes with no native geometry creation or specification interface and uses text based descriptions of mesh geometry to define building form, again making Blender a viable frontend application.
Whilst EnVi was still at prototype stage Blender introduced Python scriptable nodes. Nodes in Blender were traditionally used to apply a sequence of filters to an image but version 2.67 introduced the ability to create custom nodes via the Python API.
A nodal interface can provide a more flexible and intuitive user experience by allowing the user to construct their own task specific interface, especially if the activity undertaken can be broken down into discrete stages. These scriptable nodes therefore presented the opportunity to combine LiVi with EnVi, along with a number of other contextual analysis tools, into one node based interface called the VI-Suite. A sabbatical award from the University of Brighton in 2014 enabled the release of version 0.1, and at the time of writing version 0.4.12 of the VI-Suite is publicly available. Figure 2 shows a typical current Blender and VI-Suite window configuration showing the 3D view, where geometry is edited; the node editor, where VI-Suite simulations are constructed; the VI-Suite display panel, where visualisations are controlled; the VI-Suite material panel, where material characteristics are defined; tabular and graph OpenGL overlay elements, where result data can be visualised. Figure 3 shows a typical node set-up within Blender’s node editor for a LiVi lighting simulation with location, geometry, context and simulation nodes representing location specification, geometry export, sky export and simulation stages.

Blender interface with VI-Suite elements

Example LiVi node set-up within the VI-Suite
Nodes provide the majority of the VI-Suite UI, encompass much of its functionality and are, in terms of Python code, objects i.e. instances of a class. These node objects have properties (integer, string, menus etc) associated with them which can be exposed within the node using Blender’s standard interface elements. The nodes also contain functions, or methods, to draw and update the node. The nodes can also display buttons which, when pressed, run operators or Blender specific functions. These operators in turn run general functions that, for example, initiate a Radiance simulation or embed simulation results within the Blender mesh for visualisation. A more detailed explanation of the input elements of specific nodes is given in the next section.
Using Python objects in the form of Blender nodes has led to a modular, object-orientated code base that can be relatively easily extended to, for example, import geospatial file formats. Users have already contributed nodes for window shading analysis in EnVi and further contributions are welcome.
As the close integration of the VI-Suite with Blender offers extensive possibilities for advanced results visualisation, recent releases of the VI-Suite have concentrated on this aspect. Using the Python API to draw OpenGL graphics over the main Blender window, the VI-Suite can now display per-point numerics, scalable legends, scatter graphs and tables etc. within Blender’s 3D view (Fig. 2). In addition, legend values, scaling and colouration can all be controlled by the user.
VI-Suite capabilities
As the VI-Suite takes the approach that Blender mesh geometry forms the basis for the specification of calculation and visualisation points, any geometry data imported into Blender can be quickly turned into a sensing surface by associating a sensing material to some or all of the faces of the mesh. Simple ground planes, 3D topographical data and even building geometry can therefore all form the basis of the calculation/visualisation points.
By using Blender mesh geometry as sensing surfaces the user also has complete control over the spatial density of the calculation points. Mesh density can be increased or decreased locally, using Blender’s advanced mesh editing tools, to achieve the desired results resolution whilst minimising calculation time. This level of calculation point control can also be valuable in geospatial applications where simulations over a wide area may be desired that would require many calculation points at high spatial resolution. Instead the user can begin with a coarse sensor mesh and refine locally where greater results resolution is required.
Although originally intended for the performance analysis of buildings and their immediate context, this ability to specify any mesh based geometric surface as a sensing surface does offer a number of possibilities for geospatial analysis and these possibilities have been augmented with the ability to directly import geospatial data. These features include:
-
Import of Esri grid ascii data and conversion to Blender mesh format
-
Import of other GIS geometry data in mesh format (e.g. STL, OBJ, 3DS).
-
Creation of static and parametric terrain and urban shadow/sky view factor maps. These analyses use Blender’s in-built BVH tree and ray casting algorithms to minimise simulation time.
-
Creation of static and parametric urban scale radiation/lighting maps using Radiance.
-
Production of bitmap images/animations of results.
-
Export of calculated metrics in CSV format.
Implementation
Shadow & sky view factor mapping
Two of the types of geospatially relevant analyses that the VI-Suite can conduct are shadow and sky view factor (SVF) mapping, and both are calculated in a similar manner.
A shadow map defines the proportion of the simulation period that a point is exposed to direct sunshine assuming that the sky is clear at all times. This can be useful for agricultural or ground based solar power applications and, if building geometry is defining the sensor points, a simple analysis for Building Integrated Photovoltaic applications and building overshadowing.
A Sky View Factor (SVF) map rather simply defines the proportion of the sky hemisphere that can be seen from a point i.e. not occluded by buildings and other urban features, and is therefore not site location or time dependent [12–14]. This type of analysis is often conducted on or above the ground plane within an urban context where buildings obscure a potion of the sky, and is useful for urban sky views and street canyon enclosure assessment.
Both these analyses may require a large number of computations when conducted on large geospatial datasets, especially if the dataset is defining the sensing geometry as in Fig. 4. As in that example, if a large terrain model is defining the sensing geometry with potentially millions of calculation points, and thousands of time steps in a year, shadow map analyses may require billions of shadowing calculations. This is where the use of 3D design software, in this case Blender, can be advantageous as it provides two built-in capabilities via the Python API, often found in such software, that allows the potentially large number of calculation points generated by geospatial data to be simulated relatively quickly: Bounding Volume Hierarchy (BVH) tree creation and ray casting.

Annual shadow mapping results on a DTM
BVH trees can greatly speed up certain calculations the result of which are the positions of spatial intersections e,g. collision detection. They are a generated set of simplified, hierarchical bounding volumes encompassing the detailed mesh geometry within the scene. Intersection calculations are initially done with these simplified bounding volumes and only passed on to the detailed geometry if a bounding volume encompasses the intersection point. The use of BVH trees does not compromise the accuracy of the eventual intersection calculation. The VI-Suite automatically converts all relevant shading geometry within the scene into BVH tree representations, using an in-built Blender function, ready for ray casting.
Ray casting calculates the intersection point of a ray vector and a geometric surface representation, in this case encompassed within a bounding volume. For shadow mapping, rays are cast at each mesh sensor point from the direction of the solar position for each time step of the simulation. For sky view factor rays are cast from each patch of the subdivided sky hemisphere (Fig. 5). If the ray intersects with the BVH tree representation of the non-sensing scene geometry the point is considered to be shadowed at that simulation time step, or the sky patch obscured. The final shadow/sky view status of each geometric sensor point is then stored within the point entity itself using Blender’s custom data layers via the Python API.

Tregenza, Reinhart 577 and Reinhart 2305 sky division schemas
The shadow mapping analysis is conducted with the ‘VI Shadow Map’ node, with a ‘VI Location’ node to provide location data in terms of latitude and longitude. The node setup for a shadow map calculation is shown in Fig. 6. The shadow study node object contains a number of properties to define the simulation parameters. These properties are:
-
An ‘Ignore sensor’ boolean property to define if the sensor geometry can self-shade.
Fig. 6 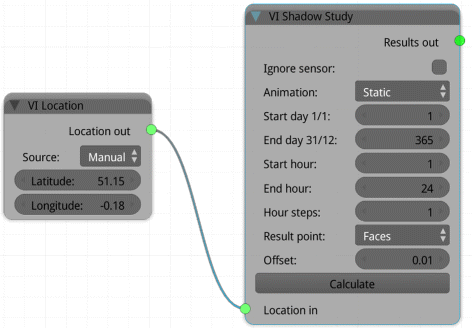
Shadow map node set-up
-
A menu property to define if a static or animated/parametric simulation is to be conducted.
-
Integer properties that define the start and end day of the simulation.
-
Integer properties that define the hour range of each simulated day. This could be used to conduct a simulation only for the mornings or ‘office’ hours.
-
An integer property to define the number of shadow calculations per hour. A larger number increases result resolution at the price of greater simulation time.
-
A menu property to define if the faces or vertices of the sensing geometry define the sensor positions.
-
A float property to define the offset of the actual calculation position from the sensing geometry.
-
An operator button to initiate the simulation and store the results within the sensing mesh.

Sky view factor is calculated with the ‘VI SVF’ node (Fig. 7) which, as no location data is required, is a stand-alone node. The node properties are similar to the shadow map node except that the time based options are not required. One new option, ‘Sky patches’, defines the subdivision of the sky hemisphere to generate the vector directions for the ray casting calculation. The sky hemisphere can be divided according to the Tregenza (145 patches), Reinhart 577 (577 patches) and Reinhart 2305 (2305 patches) schemas commonly used in daylighting analysis [15]. Figure 5 shows a graphical representation of the three subdivision schemas. The greater the sub-divisions the greater the result accuracy at the cost of increased simulation time.

Sky view factor node
Once the simulation has completed the results can be exported to CSV formatted text file or visualised within Blender. The exported CSV file contains the point locations and results for each mesh sensing object and can be used to import the results data back into geospatial or other visualisation software. Visualisation within Blender copies the sensing meshes and colours the copies according to the results stored within the sensing points. Colour scale, legend scale, per point numeric display can then be controlled with the options in ‘VI-Suite Display’ panel. Results can be rendered out to bitmap image. Figure 4 shows a Digital Terrain Map (DTM) of the south coast of the UK overlaid with an annual shadow mapping results plane consisting of 12 million sensor points at 5 m resolution. The DTM used is a 20 ×15 km dataset by Ordnance Survey of Great Britain, obtained from Edina Digimaps [16] by importing directly the Esri grid file. This rather extreme example required 105 billion shadow calculations (12 million data points x 8760 h in a year), which, by employing BVH trees and ray casting, took 14 h on a single 3.1 GHz cpu. However, as first class Blender mesh geometry is used as the sensor points approximately 1kB of available ram is required for each sensor point to run the simulation efficiently (12 GB of ram in this particular case).
Irradiance mapping
In addition to irradiance and illuminance calculations for discrete moments in time the VI-Suite can also create irradiance maps for periods of up to a year. Irradiance maps define the cumulative solar radiation power available at a point over the simulation period. The units are kWh/m 2 for total radiation and luxhours for visible radiation. A kWh/m 2 calculation can be useful for quantifying the solar potential of building surfaces for installing solar panels [17–19], to determine whether a surface is sufficiently insolated to invest in a photovoltaic panel and to locate the most favourable parts of a building to place one as the amount of power produced by a panel can be estimated by multiplying the kWh/m 2 value by a panel’s rated efficiency. Several research papers dealing with energy demand estimations benefited from such analyses [20–22]. Such simulations may also be used in automatic property valuation considering that solar radiation influences flat prices [23]. Other applications involving the computation of the solar exposure are urban planning [24, 25], thermal comfort [26], and detecting buildings that may be subject to overheating [27].
Irradiance mapping, although producing similar results to the shadow mapping calculations detailed above, is achieved with the LiVi component of the VI-Suite and uses Radiance in the background to calculate results. Irradiance mapping, in a similar way to shadow mapping, can be conducted on terrain meshes and on building geometry imported via Esri grid file or via the import of standard mesh formats.
The node setup shown earlier in Fig. 3 is an example of an irradiance mapping pipeline. The nodes each represent a step in the conversion to Radiance format and the control of the Radiance simulation. These steps are:
Geometry conversion The Blender mesh geometry must be converted to Radiance format and this is achieved with the operator button within the LiVi Geometry node. Not only does the spatial geometry need to be exported, but as the distribution of light or radiation within a scene can be influenced by material finish, the materials associated with the Blender meshes have to be converted to valid Radiance material definitions. Radiance material definitions are defined in the VI Material tab in the Blender interface. A node boolean property allows the user to specify whether a static or parametric analysis is to be conducted. For the latter a Blender animation of the parametric changes should be set up in advance. Any geometry within the scene being used to define the sensor points are also exported at this stage and the node allows the user, via a menu property, to select whether the vertices or faces of the relevant mesh geometry are the definer of these positions.
Context conversion The LiVi Context node defines the type of lighting analysis to be conducted, and the type of sky for the simulation; the latter again being exported to a valid Radiance description. For an irradiance map the menu properties in the LiVi Context node should specify a Climate Based Daylight Modelling (CBDM) analysis type and an ‘Exposure’ metric type. This type of analysis will require an EnergyPlus formatted weather (EPW) file selected in the VI Location node to provide the hourly beam and diffuse solar radiation data for the chosen location. The simulation period can also be set here with integer properties. During context conversion a cumulative high dynamic range (HDR) image of the sky brightness (including beam and diffuse elements) for the chosen period is produced for 145 discrete Tregenza (Fig. 5) patches of the sky (Fig. 8). As this HDR image contains accurate cumulative brightness data according to the EPW file, it can be used as a source of radiance when wrapped around the simulation scene. This approach avoids having to do a calculation for each hour step and makes the calculation of cumulative irradiance for a large number of sensor points relatively quick (an irradiance map for the 12 million sensor points on the ground plane in Fig. 4 was generated in 13.5 h on a dual core cpu).

An example of a cumulative sky brightness HDR panorama for Paris, France
Simulation initiation The LiVi Simulation node has a menu operator to specify the accuracy of the simulation and initiates the simulation itself. In a similar manner to the shadow study analysis, the results, which are in this case cumulative illuminance (luxhours) and cumulative irradiance (kWh/m 2), are calculated for each specified sensor point and stored back within the data point. Once the simulation is completed results can once again either be exported to CSV file or visualised and rendered within Blender.
Results and discussion
Overview
In this section we demonstrate the use of VI-Suite for environmental analyses using geospatial data. It is relevant to note that the presented workflow is entirely supported by free and open software and datasets.
Of the three geospatially relevant analyses that the VI-Suite can conduct: shadow mapping, sky view factor mapping and irradiance mapping the focus here is on solar irradiance analysis of buildings and ground shadow analysis. These two spatial analyses are among the most applicable ones in GIS because they are used in a wide range of use cases [28, 29], although they are also often used in conjunction with other analyses such as sky view factor [13, 30]. An overview of the example cases is given below.
In GIS analysing the exposure to sun may be conducted at both coarse (e.g. terrain) and detailed (e.g. building) scales [31–33], and the ability to move between different spatial resolutions with the VI-Suite are demonstrated here.
Dataset
In the analyses presented here a 3D city model is used to demonstrate a ground level shadow calculation and building level irradiance calculation.
The 3D city model is a dataset by the City of The Hague in the Netherlands5. The dataset is provided in the City Geography Markup Language (CityGML) [34], and it was converted [35] to the common OBJ format with level of detail (LOD) 2 that included the roof profiles and with surfaces thematically differentiated [36] i.e. wall and roof geometry is exported as separate OBJ objects. Although not used in the shadow map example below, the convenience of this mesh separation is demonstrated in the irradiance mapping example. While the conversion of CityGML to computer graphics formats such as OBJ often entails data loss (e.g. attributes are not preserved), it does not affect the spatial analyses in question since the required data (i.e. geometry and semantic differentiation of surfaces) are retained.
The city model used here consists of around 50,000 planar faces, and covers an area of approximately 1 sq km. As each Blender mesh face requires approximately 1 kB of ram, this model can be imported/simulated with the VI-Suite using approximately 50 MB of ram. Much larger city models can therefore be simulated. As a rough approximation a city model covering 100 sq km could be analysed with 5 GB of ram.
Shadow map
The shadow mapping was carried out using a ground plane as a sensing surface. Figure 9 presents the results of this shadow study in the urban environment for the whole month of June at 4 calculation steps per hour (as specified within the VI Shadow Map node) with a relatively coarse ground plane sub-division. Analyses such as these allow for a quick appraisal of the distribution of sunlight penetration into a city.

Shadow analysis performed with the VI-Suite
If a greater spatial result resolution is required the sensing geometry can be locally sub-divided using Blender’s mesh editing tools. This local refinement can be useful for assessing in more detail the impact of a building, or proposed building, on the sunlight penetration in specific parts of the city. Figure 10 shows local mesh and result refinement around the block of buildings in the middle of the image. At this resolution the changes in shadowing from making one of the central buildings taller, or by introducing shading elements between buildings, could be seen in detail.

Shadow analysis with local sensing mesh refinement
Irradiance
The 3D city model was also used to provide calculation points for the simulation of irradiance levels. The first example takes advantage of the thematic differentiation provided by CityGML. The CityGML dataset was converted to OBJ with the CityGML2OBJs Python script, which preserves the semantic description of surfaces by creating multiple OBJ datasets [35]. Blender understands this differentiation thanks to which a material specifically for the roofs may be created. This material can then be designated as a sensing material within the VI-Suite interface and a coarse irradiance map calculated at roof level (Fig. 11). Maps such as these can quickly identify the regions of the city’s roof-scape that have the potential to provide a certain amount of solar electrical power to hit, for example, economic criteria.

Annual irradiance analysis of the Hague using the nearest available EPW climate file (Amsterdam). Results of analyses such as this one may be used for analysing the solar exposure of rooftops for placement of solar panels, among other applications
Irradiance levels can also be calculated on refined mesh geometry on a single, or part of a single, building. Figure 12 shows annual irradiance results on the facade panels of a selected building with the corresponding legend. Other buildings are wire-framed for the results visualisation.

Visualisation of an annual irradiance analysis for a building facade showing legend and tabular overlays
As well as a coloured visualisation of the results, the VI-Suite offers per-point numerical display over selected sensor mesh elements (Fig. 13). Display is confined to only those sensor elements selected within the underlying Blender mesh, which offers fine grained control over the numerical display. Figure 13 for example shows numerical display with only the mesh faces under one façade section selected. An analysis like this may be useful if, for example, it has been determined that a solar panel must receive at least 800kWh/m 2 to be an economical replacement for the conventional facade cladding. In this example this would be the case for most of the facade panels in each of the top 10 rows of facade panels for the selected facade section.

Annual irradiance values on the façade of a building with numerical display
Conclusions
The VI-Suite deeply embeds the ability to analyse the performance of architectural and geospatial forms within the 3D content creation suite Blender. This approach attempts to bridge the gap between analysis and digital design software. Using Blender mesh geometry (faces or vertices) as the specifier of calculation points within the scene means calculation points can be manipulated with the same level of flexibility, using the same tools, as conventional Blender mesh geometry. This makes it easy to move between scales; calculating over coarse grids for large area analyses, finer grids for detailed architectural studies or a combination of the two. Using mesh geometry as a repository and visualiser for the calculated data also offers the possibility to visualise results with the same flexibility and control as with conventional Blender meshes offering transparency, wireframes, animations etc and even allows for results planes to be exported from Blender as mesh geometry, or interchanged between Blender files. This latter capability would, for example, allow multiple result sets to be visualised together for comparative purposes within a single Blender scene.
Although originally geared towards architectural studies, the use of mesh geometry to specify calculations and visualisation points means that any valid mesh geometry can be studied. As geospatial data, such as Esri grid and CityGML files, can be converted (including by the VI-Suite itself) to Blender meshes, the VI-Suite is able to conduct certain types of analysis on these geospatial datasets. This brings geospatial analysis into the computer graphics software realm, leveraging the capabilities of Blender, such as BVH tree generation and ray casting, for GIS. This may be an end in itself, with the ultimate output being images and animations generated by Blender, but also enables further analysis with conventional geospatial software by exporting results to CSV file.
This original focus on generally smaller architectural studies does however lead to some disadvantages of using the VI-Suite for geospatial analysis. One is that the VI-Suite does not geolocate any data beyond the specification of a single latitude and longitude by the user. A shadow map simulation of a very large area may therefore need to be split up into smaller simulations, each with its own latitude and longitude, to achieve the desired simulation accuracy. Also, the use of first class Blender mesh geometry as a sensor/result entity can lead to high computer memory requirements; approximately 1kB of ram is required per sensor point. This is rarely an issue when dealing with result resolutions at an architectural scale but may be an issue when dealing with very large geospatial datasets. Finally, although Blender can import bitmap image files, geometry in common mesh formats and Esri grid ascii files, other geospatial specific file formats are not currently supported.
As a demonstration, shadow and irradiance analyses on a 3D city model of the Hague, at the urban and building scales, has been conducted. The former case, conducted on a ground plane, can quickly identify the solar exposure and lighting characteristics of a city. The latter can quickly establish the feasibility and position of optimal solar energy installations.
For future work the implementation of additional analyses such as computational fluid dynamics (CFD) is foreseen, but the authors would also like to encourage suggestions, or indeed code contributions, from the geospatial community to enhance the VI-Suite’s current GIS capabilities, for example to allow the import of additional geospatial data formats such as GeoTIFF and shapefiles.
Availability and requirements
The VI-Suite source code can be viewed and checked out from a Github repository6, and as the VI-Suite is written in Python the source code is also available within each release. Zip files containing Blender, VI-Suite, Radiance and EnergyPlus for Windows and macOS systems can be found at the main project website7 along with a comprehensive manual [1]. The VI-Suite addon with just the Radiance and EnergyPlus executables is also available for Linux 64bit systems. At least OpenGL 2.1 is required. The licence is GPL version 2.
References
Southall R. Simulations and Visualisations with the VI-Suite. School of Art, Design & Media, University of Brighton. 2017. School of Art, Design & Media, University of Brighton. http://arts.brighton.ac.uk/projects/vi-suite/documentation.
Kent BR. 3D Scientific Visualization with Blender. San Rafael: Morgan & Claypool; 2015.
Zoppè M, Porozov Y, Andrei R, Cianchetta S, Zini MF, Loni T, Caudai C, Callieri M. Using Blender for molecular animation and scientific representation. In: Blender Conference. Amsterdam: 2008.
Pyka M, Hertog M, Fernandez R, Hauke S, Heider D, Dannlowski U, Konrad C. fMRI data visualization with BrainBlend and Blender. Neuroinformatics. 2010; 8(1):21–31.
Kent BR. Visualizing astronomical data with Blender. Publ Astron Soc Pac. 2013; 125(928):731.
Scianna A. Building 3D GIS data models using open source software. Appl Geomatics. 2013; 5(2):119–32.
Tabrizian P, Petrasova A, Harmon B, Petras V, Mitasova H, Meentemeyer R. Immersive tangible geospatial modeling. In: Proceedings of the 24th ACM SIGSPATIAL International Conference on Advances in Geographic Information Systems. San Francisco: ACM: 2016. p. 88.
Ilba M. An Analysis and 3D Visualization of Shading of Urban Spatial Objects with the Use of the Phython Programming Language in the Blender Application. Geomatics Environ Eng. 2015; 9:35–44.
Larson GW, Shakespeare R. Rendering with Radiance: the Art and Science of Lighting Visualization. Seattle: Booksurge Llc; 2004.
Compagnon R. The RADIANCE simulation software in the architecture teaching context. In: Florence International Conference for Teachers of Architecture vol. 2. Firenze: 1997.
Crawley DB, Pedersen CO, Lawrie LK, Winkelmann FC. EnergyPlus: energy simulation program. ASHRAE J. 2000; 42(4):49.
Svensson MK. Sky view factor analysis — implications for urban air temperature differences. Meteorol Appl. 2004; 11(3):201–11. doi:10.1017/S1350482704001288.
Besuievsky G, Beckers B, Patow G. Skyline-based geometric simplification for urban solar analysis. Graph Model. 2017. In press.
Yi YK, Kim H. Universal Visible Sky Factor: A method for calculating the three-dimensional visible sky ratio. Build Environ. 2017; 123:390–403.
Ward G, Mistrick R, Lee ES, McNeil A, Jonsson J. Simulating the daylight performance of complex fenestration systems using bidirectional scattering distribution functions within radiance. Leukos. 2011; 7(4):241–61.
Morris B, Medyckyj-Scott D, Burnhill P. EDINA Digimap: new developments in the Internet Mapping and Data Service for the UK Higher Education community. Liber Q. 2000; 10(4):445–53.
Li Y, Liu C. Estimating solar energy potentials on pitched roofs. Energy Build. 2017; 139:101–7.
Lukač N, Seme S, Dežan K, žalik B, Štumberger G. Economic and environmental assessment of rooftops regarding suitability for photovoltaic systems installation based on remote sensing data. Energy. 2016; 107:854–65.
Li Z, Zhang Z, Davey K. Estimating Geographical PV Potential Using LiDAR Data for Buildings in Downtown San Francisco. Trans GIS. 2015; 19(6):930–63.
Agugiaro G. Energy planning tools and CityGML-based 3D virtual city models: experiences from Trento (Italy). Appl Geomatics. 2016; 8(1):41–56.
Fonseca JA, Nguyen TA, Schlueter A, Marechal F. City Energy Analyst (CEA): Integrated framework for analysis and optimization of building energy systems in neighborhoods and city districts. Energy Build. 2016; 113:202–26.
Bahu JM, Koch A, Kremers E, Murshed SM. Towards a 3D Spatial Urban Energy Modelling Approach. Int J 3-D Inf Model. 2015; 3(3):1–16.
Helbich M, Jochem A, Mücke W, Höfle B. Boosting the predictive accuracy of urban hedonic house price models through airborne laser scanning. Comput Environ Urban Syst. 2013; 39:81–92.
Herbert G, Chen X. A comparison of usefulness of 2D and 3D representations of urban planning. Cartogr Geogr Inf Sci. 2015; 42(1):22–32.
Lange E, Hehl-Lange S. Combining a participatory planning approach with a virtual landscape model for the siting of wind turbines. J Environ Plan Manag. 2005; 48(6):833–52.
Hwang RL, Lin TP, Matzarakis A. Seasonal effects of urban street shading on long-term outdoor thermal comfort. Build Environ. 2011; 46(4):863–70.
Nichol J, Wong MS. Modeling urban environmental quality in a tropical city. Landsc Urban Plan. 2005; 73(1):49–58.
Biljecki F, Stoter J, Ledoux H, Zlatanova S, Çöltekin A. Applications of 3D City Models: State of the Art Review. ISPRS Int J Geo-Information. 2015; 4(4):2842–889.
Liang J, Gong J, Zhou J, Zhou J, Ibrahim AN, Li M, Li M. An open-source 3D solar radiation model integrated with a 3D Geographic Information System. Environ Model Softw. 2015; 64:94–101.
Liang J, Gong J. A Sparse Voxel Octree-Based Framework for Computing Solar Radiation Using 3D City Models. ISPRS Int J Geo-Information. 2017; 6(4):106.
Kumar L, Skidmore AK, Knowles E. Modelling topographic variation in solar radiation in a GIS environment. Int J Geogr Inf Sci. 1997; 11(5):475–97.
Biljecki F, Heuvelink GBM, Ledoux H, Stoter J. Propagation of positional error in 3D GIS: estimation of the solar irradiation of building roofs. Int J Geogr Inf Sci. 2015; 29(12):2269–294.
Hofierka J, Zlocha M. A New 3-D Solar Radiation Model for 3-D City Models. Trans GIS. 2012; 16(5):681–90.
Gröger G, Plümer L. CityGML – Interoperable semantic 3D city models. ISPRS J Photogramm Remote Sens. 2012; 71:12–33.
Biljecki F, Arroyo Ohori K. Automatic Semantic-preserving Conversion Between OBJ and CityGML. In: Eurographics Workshop on Urban Data Modelling and Visualisation 2015. Delft: Eurographics: 2015. p. 25–30.
Biljecki F, Ledoux H, Stoter J. An improved LOD specification for 3D building models. Comput Environ Urban Syst. 2016; 59:25–37.
Acknowledgements
The creation of the VI-Suite would not be possible without the work of the Blender Foundation, and many thanks go to them for creating and distributing Blender. Thanks also go to:
∙ The Lawrence Berkley National Laboratory for creating Radiance.
∙ The US Department of Energy for creating EnergyPlus
∙ The National Renewable Energy Laboratory for providing Radiance and EnergyPlus binaries
∙ The Matplotlib team, and John Hunter in particular, for creating and releasing matplotlib.
∙ The Kivy Organization for releasing the UI framework Kivy.
We thank the anonymous reviewers and editor for their helpful comments on the paper.
Funding
The first author would like to thank the University of Brighton Sabbatical scheme for funding early development of the VI-Suite. The second author was supported in the frame of the research programme Innovational Research Incentives Scheme with project number 11300, which is financed by the Netherlands Organisation for Scientific Research (NWO).
Author information
Authors and Affiliations
Contributions
RS developed the software, and wrote most of the paper. FB generated the use cases on the 3D city model and contributed to the writing. Both authors read and approved the final manuscript.
Corresponding author
Ethics declarations
Competing interests
The authors declare that they have no competing interests.
Publisher’s Note
Springer Nature remains neutral with regard to jurisdictional claims in published maps and institutional affiliations.
Rights and permissions
Open Access This article is distributed under the terms of the Creative Commons Attribution 4.0 International License (http://creativecommons.org/licenses/by/4.0/), which permits unrestricted use, distribution, and reproduction in any medium, provided you give appropriate credit to the original author(s) and the source, provide a link to the Creative Commons license, and indicate if changes were made.
About this article

Cite this article
Southall, R., Biljecki, F. The VI-Suite: a set of environmental analysis tools with geospatial data applications. Open geospatial data, softw. stand. 2, 23 (2017). https://doi.org/10.1186/s40965-017-0036-1
Received:
Accepted:
Published:
DOI: https://doi.org/10.1186/s40965-017-0036-1