- Software
- Open access
- Published:
OpenStreetMap history for intrinsic quality assessment: Is OSM up-to-date?
Open Geospatial Data, Software and Standards volume 4, Article number: 9 (2019)
Abstract
OpenStreetMap (OSM) is a well-known crowdsourcing project which aims to create a geospatial database of the whole world. Intrinsic approaches based on the analysis of the history of data, i.e. its evolution over time, have become an established way to assess OSM quality. After a comprehensive review of scientific as well as software applications focused on the visualization, analysis and processing of OSM history, the paper presents “Is OSM up-to-date?”, an open source web application addressing the need of OSM contributors, community leaders and researchers to quickly assess OSM intrinsic quality based on the object history for any specific region. The software, mainly written in Python, can be also run in the command line or inside a Docker container. The technical architecture, sample applications and future developments of the software are also presented in the paper.
Introduction
OpenStreetMap (OSM) is the most successful crowdsourced geographic information project to date [1]. It was initiated in 2004 in response to the mainstream presence of legal or technical restrictions on available maps, with the ultimate goal of creating and distributing free geographic data for the whole world [2]. As a matter of fact, the OSM geospatial database is distributed under the open access Open Database License (ODbL) [3], allowing freely using, modifying and building upon the database under non-restrictive conditions such as providing attribution to the OSM contributors. The relatively easy way - even for people with no background in geography or computer science - to create OSM data has attracted so far an ever increasing number of contributors to the project. At the time of writing (June 2019), the project counts about 5.5 million registered users [4], while the number of contributors, i.e. the users who have made at least one edit to the database, has exceeded the threshold of 1 million only in March 2018 [5]. In turn, a rich ecosystem of software tools, services and applications allows a wide number of developers, humanitarian operators, industry and governmental actors to exploit OSM data on a daily basis and for a variety of purposes [6].
Being a potentially useful source of geospatial information for many disciplines, OSM has attracted as well an increasing interest from the academic and scientific community [7]. Not surprisingly, the topic which so far has been most investigated by researchers is OSM quality assessment [8], since crowdsourced geographic information suffers by definition from a general lack of quality assurance [9]. OSM quality has been traditionally assessed using the standard quality parameters available for geospatial datasets, e.g. positional accuracy, completeness, logical consistency, thematic accuracy, temporal accuracy, lineage, up-to-dateness, and fitness-for-use [9–12]. The latter suggests that quality should not be measured in absolute terms, since crowdsourced datasets such as OSM may have different degrees of suitability for specific purposes and users’ demands.
In the case of OSM these quality parameters have been traditionally measured through extrinsic quality approaches, i.e. by comparing OSM against external reference datasets considered as the ground truth, such as those provided by national mapping agencies and commercial mapping companies. The quality parameters which have been most investigated through extrinsic approaches are positional accuracy, completeness and thematic accuracy, with focus mainly placed - in descending order - on OSM roads [13–17], buildings [18–21], land use [22–24] and points of interest [25, 26]. Overall, the available literature agrees that OSM quality shows very heterogeneous patterns across space, ranging from areas where it favourably compares with authoritative datasets (typically the most urbanized areas) to areas where data is either missing or of poor quality.
However, OSM and authoritative datasets are extremely different by nature, e.g. in terms of their production and update processes which often lead OSM to be clearly more detailed, accurate and complete than authoritative datasets, thus violating the basic hypothesis of using the latter as ground truth [27]. In addition, in many parts of the world authoritative datasets are either missing or not suitable for comparison (e.g. because their scale is too course and not comparable to OSM). For these reasons, OSM intrinsic assessment methods have begun to appear with the goal of determining OSM quality (mainly meant as fitness-for-use) by only looking at the temporal evolution of OSM itself, i.e. without comparison against third-party datasets. Since each edit to the database is also stored together with the database itself, the whole history of OSM is in fact available and provides an extremely rich data source for a variety of purposes, including quality assessment. Accordingly, many software implementations have been developed, which are based on the analysis of OSM history. The software “Is OSM up-to-date?”, which is described in this paper, contributes to this flourishing set of software applications with the main goal of providing intrinsic quality measures for single OSM objects.
The remainder of the paper is organized as follows. “OSM data model and OSM history” section provides some background information on the OSM data model and the OSM history. “Applications based on OSM history” section revises the literature on OSM intrinsic assessment through the analysis of both scientific applications and available software implementations based on OSM history. The latter allow to classify the multitude of existing applications and to better position the software “Is OSM up-to-date?”, whose rationale and architecture are described in detail in “Implementation: Is OSM up-to-date?” section. “Application” section presents the two possible applications of the software, i.e. via the web interface and the command line interface. “Conclusions and future development” section concludes the paper by summarizing the main features of the software and tracing its future development.
OSM data model and OSM history
According to the simplified OSM conceptual data model shown in Fig. 1, there are four main data types. Three of them, namely nodes, ways and relations, include a geometric component. A node, defined by a latitude and a longitude, is used to represent standalone point features such as trees, traffic lights or points of interests, and consists of geographic coordinates (latitude and longitude). A way is an ordered list of between 2 and 2000 node references, which can represent both linear features (polylines) such as roads and rivers, and areal features (polygons) such as buildings and land use areas. The limit of 2000 nodes per way was established in 2009 with the changes from version 0.5 to 0.6 of the OSM API [28], therefore ways created earlier might reference any number of nodes. A relation is a special structure used to represent polylines or polygons of more than 2000 nodes and relationships between zero or more nodes, ways and other relations [29, 30]. An example of relation is a bus route, which links the ways of the roads traveled by the bus and the nodes of the bus stops. Another common example is a polygon with holes, e.g. a building with an inner courtyard, which links the outer way of the building outline and the inner way of the courtyard. Each single OSM node, way and relation has an id number that uniquely identifies it. For example, the node accessible at https://www.openstreetmap.org/node/5207201516 (where 5207201516 is the node id) currently represents the Notting Hill subway station in London; similarly, the way accessible at https://www.openstreetmap.org/way/32965412 , (where 32965412 is the way id) currently represents the Statue of Liberty in New York; and the relation accessible at https://www.openstreetmap.org/relation/7515426 (where 7515426 is the relation id) currently represents the Louvre Museum in Paris. It is worth clarifying that the ids of nodes, ways and relations cannot be considered as permanent ids of real-world features [31]. In other words, a real-world feature which is currently represented by e.g. a node might in the future be represented by another node or by a way or a relation. As an example, the Louvre Museum was in the past represented by another relation with id 3262297 and might be represented by new relations in the future. This fundamental difference between the permanent ids of real-world features and the OSM ids of nodes, ways and relations should be properly considered when analyzing OSM history data.

Simplified OSM conceptual data model. Source: [30]
Tags are the fourth data type of the OSM data model (see Fig. 1) and specify the attributes of real-world features represented by nodes, ways and relations. Tags consist of key-value pairs, where each key specifies a property and each value defines the value of the node, way or relation for that property [32]. Nodes, ways and relations can have from a minimum of zero tags (e.g. in the case of nodes solely referenced by OSM ways) up to any number of tags. In the following, the term OSM object is used to indicate a node, way or relation having at least one tag; thus, with few exceptions, OSM objects represent real-world features. For example, the main tag associated to the way of the Statue of Liberty in New York is artwork_type=statue, where artwork_type is the key and statue the value. This tag is accompanied by many other tags defining additional properties, such as name=Statue of Liberty, indicating the name of the statue; tourism=attraction, meaning that the Statue of Liberty is a tourism attraction; and wikipedia=en:Statue of Liberty, linking the corresponding page in the English Wikipedia. The OSM Map Features wiki page [33], together with all the wiki pages reachable from it, lists the official tags to be used for labelling real-world objects. This reference list of tags was also termed folksonomy (i.e. a crowdsourced taxonomy), since it represents the evolving product of the negotiation process between OSM contributors [34]. The popular taginfo service [35] provides statistics about the use of OSM tags and their combination with other tags.
Each time a contributor performs an editing session and saves a group of changes to the OSM database, e.g. after creating, deleting and/or modifying one or more OSM nodes, ways and/or relations, in terms of their geometry and/or tags, a so-called changeset is created [36]. As mentioned above, each changeset - which is associated to one single contributor - is also stored in the OSM database through the association of a unique and persistent id. For example, at the time of writing (June 2019), the latest changeset including edits to the way of the Statue of Liberty is accessible at https://www.openstreetmap.org/changeset/68221957 , where 68221957 is the changeset id. Since each changeset carries information about the edits made to the OSM database (i.e. which nodes, ways, relations and/or tags were added, modified and/or deleted, and how), the contributor who made the edits, and the timestamp of the edits, the availability of all the changesets ensures the availability of the whole history of each OSM node, way and relation, and - on a larger scale - of the full OSM database.
However, the history of the OSM database is rarely analyzed through the full set of OSM changesets. There are in fact three main ways to access OSM history. The first is through the use of the OSM API [37], which provides read and write access to the OSM database and allows to retrieve its full temporal evolution. The Overpass API [38], which is widely used through the popular web-based frontend Overpass Turbo [39], provides instead read-only access to the OSM database, including the history. However, only since the latest release (v0.7.55) [40] the Overpass API makes it possible to query all versions of OSM nodes, ways and relations [38]. The main limitation of the API is the lack of any history data from before the switch of OSM license from Creative Commons Attribution-ShareAlike (CC BY-SA) 2.0 [41] to ODbL happened in late 2012 [42]. Thus, the Overpass API might return incomplete results for many OSM nodes, ways and relations. Finally, the whole history of OSM is also packed in an ad hoc file, named Full History Planet File [43]. Downloadable from [44] in both the standard OSM eXtensible Markup Language (XML) format (currently around 118 GB) and the compressed Protocolbuffer Binary Format (PBF) format (currently around 75 GB), it includes a complete copy of the whole OSM database, including editing history. It is worth noting that both the Full History Planet File and the OSM API do not return history data from before the introduction of OSM API version 0.5 in late 2007 [45]. The impact is this time very limited, due to the relatively low number of OSM nodes, ways and relations existing at the time. “Software applications” section in the following lists the available software implementations specifically developed to work with the OSM history, accessed in one of these three possible ways.
Applications based on OSM history
Scientific applications
OSM history has been investigated by many researchers to achieve a number of objectives. Quality assessment is by far the most frequently occurring. Ciepłuch et al. [46] developed a set of quality indicators for OSM which also considered the history and profiling of contributors. Similarly, the intrinsic methods developed by Keßler and de Groot [47] and Muttaqien et al. [48] modelled the quality of OSM objects based on historical information such as the number of contributors and the number of versions. The history of OSM objects and OSM contributors was exploited by Mooney and Corcoran [49] to analyse contributor patterns in seven cities around the world. Gröchenig et al. [50] developed an intrinsic approach for the assessment of OSM completeness through the analysis of community contributions over time. A novel approach for improving the positional accuracy and completeness of the OSM road network using the OSM history was proposed by Nasiri et al. [51]. Barron et al. [52] developed a comprehensive framework for OSM intrinsic quality assessment, which includes more than 25 methods and indicators exclusively based on OSM history.
Availability of OSM history was also exploited for the intrinsic analysis of the temporal evolution of specific OSM objects. For example, the growth of the OSM road network was analyzed for countries such as Ireland [53] and Germany [54], and cities such as Beijing [55] and Ankara [56]. Barrington-Leigh and Millard-Ball assessed the completeness of the OSM road network at the global level - finding a value of about 83% - by also studying its historical growth [17]. A recent work by Tian et al. [57] analyzed the evolution from 2012 to 2017 of OSM buildings in China. Jokar Arsanjani et al. [58] modelled OSM evolution in Heidelberg through a spatio-temporal analysis of OSM contributions, while Minghini et al. [59] performed an intrinsic analysis of OSM nodes evolution in Dar es Salaam, highlighting clear spatio-temporal patterns driven by a community mapping project. Using intrinsic quality indicators based on OSM history, Sehra et al. [60] assessed OSM evolution in India. OSM historical information was also used as a means to characterize the contributors’ response in the aftermath of natural disasters, e.g. in terms of frequency of updates and types of contributors (novice vs. experienced OSM users) [61–63].
Software applications
In contrast to scientific applications, software applications based on OSM history have been developed for a much wider variety of purposes and target beneficiaries, including OSM contributors, community members, researchers and - in turn - other developers. Table 1 includes an updated list of the most popular such applications and classifies them according to the overall aim, type of application, source of OSM history and software license.
In terms of aim, software applications are grouped into the following categories: Visualization, when they display the current version (or a specific version in time) of the database and/or information on specific objects or changesets, without aggregation, processing or computation of additional information; Statistics, when they make use of OSM history to produce numerical data and/or graphs; Analysis, when they provide an interface to filter, aggregate and perform computation on OSM historical information; and Conversion, when they transform historical OSM data into formats which are more suitable for analysis.
Available software applications based on OSM history are of different types: Web pages, i.e. static web pages, generated or regularly updated by a script or a user; Web apps, i.e. interactive web pages (also known as web applications); Applications, i.e. regular software applications to be downloaded and executed, without the need of a browser engine to run; Frameworks, i.e. software that can be used to build new software or scripts, not meant for end users; and Tools, i.e. applications (for both users and developers) used to produce intermediate results which can then be exploited for further analysis.
As already mentioned, software applications can retrieve OSM history either on-the-fly, thanks to the OSM API [37] or the Overpass API [38], or by importing the Full History Planet File [43].
In terms of visualization, the easiest way to access OSM history is through the OSM website [64], which - in addition to map browsing, routing and other features - also offers historical information for each OSM object selected. Achavi [65] is a JavaScript web app leveraging the Overpass API to display OSM changes happened in any user-specified time frame. Based on the OSM Full History Planet File, OSMatrix [66, 67] offers web-based visualization of OSM spatio-temporal quality indicators using a hexagonal grid. This web application is no longer maintained and was recently replaced by OSM History Explorer [68]. Based on the Ohsome platform [69], it offers grid-based visualizations of the density of a number of predefined variables connected to OSM objects (number of buildings, length of different types of roads, etc.) for any given region and at any specific time (month) in history. OSM Changeset Analyzer (OSMCha) [70, 71] is a web application to validate suspicious OSM changesets based on a number of criteria such as location, comment, date, number of modified objects, user, source, and editor. Another popular web application to analyze changesets is Who did it? [72]. OSM Deep History [73] and OSM History Viewer by PeWu [74] are web applications providing a simplified access to the history of single OSM objects, while the OSM History Renderer application [75] generates animations of OSM history for any specified region and time frame. A similar web application is Visualize Change [76], which graphically shows the evolution of roads and buildings over time. OSM History Viewer (osmrmhv) [77] visualises the changes made in single changesets - using different colors for different actions (delete, modify, create) and analyses the history of OSM relations, while Show me the way [78] is a popular near-real-time graphical representation of the latest OSM edits. Using the OSM Full History Planet File, OSMvis [79, 80] offers a number of visualizations to explore the generation, modification, and use of OSM through the methods of information visualization. Finally, OSM Latest Changes [81] lists the latest changesets happened in any given region and highlights the ones corresponding to the object selected on the map.
Statistics on the OSM history can be found first of all in the OSM wiki [82], where multiple plots are displayed showing OSM evolution in terms of both objects and users. Another rich source of information on OSM evolution is OSMstats [83], which offers statistics and graphs about OSM users, objects and changesets both at the global and country-level scales. Statistics on the time, frequency, place and type of mapping for each OSM user are provided by the web application How did you contribute to OpenStreetMap? [84]. For any user-selected area, the QXOSM web application [85, 86] provides statistics and plots of different indexes for both objects and users, computed from the OSM history. Specific statistics on the history of OSM roads (and their type) by country are provided by the web application osmstats.stevecoast.com [87], while OSM Tag History [88] produces graphics on the evolution in the usage of specific tags over time and the comparison between selected tags on a global scale. Brave Mappers [89] creates colourful graphics and statistics showing OSM contributors’ activity in a specific area. iOSMAnalyzer [52] is a tool for intrinsic OSM data quality analysis, which takes the Full History Planet File as input and generates statistics, maps and diagrams to assess the quality of selected areas. A number of web applications combine visualization and statistics based on OSM history. Examples are OSM Analytics [90], which describes the evolution of OSM objects in a given region and time frame and offers as well a side by side comparison of the OSM map at different points in time; and OSM Live Changes [91], which provides near-real-time visualization and statistics of OSM edits in the whole world. The Oshome Dashboard [92], based again on the Oshome platform [69], allows to analyze the OSM history based on advanced filtering and grouping functionalities on keys, values, region of interest and time, generating plots and returning results in a JSON or CSV file.
Two frameworks for the analysis of OSM history based on the Full History Planet File are worth mentioning. The first is the already mentioned Ohsome platform [69], a powerful big data framework leveraging the OpenStreetMap History Database (OSHDB) [93] to offer researchers fast data access and flexible analysis methods. Similarly, OSMesa [94] provides a rich collection of tools to simplify the analysis and processing of OSM history.
There are finally many applications for conversion of OSM history data. The EPIC-OSM framework [95] processes the OSM Full History Planet File with predefined queries, called “questions”, and extracts descriptive analytics to understand community contributions and collaboration in OSM. OSM History Importer [75] converts OSM history into a PostgreSQL/PostGIS relational database, allowing the use of SQL as query language. Although it is not an analysis framework and is currently quite old, for a long time it has been the only software allowing the analysis of historical OSM edits. The OSM PBF Foreign Data Wrapper [96] allows to query OSM history stored into a PBF file directly from PostgreSQL. Indexing is not supported and queries can be slow, but this issue can be avoided by importing the history into a native PostgreSQL database. OSM Parquetizer [97] allows instead to convert the OSM Full History Planet File into a Parquet file, suitable for big data analysis within the Hadoop ecosystem. Osmium [98] is a powerful library to extract and convert the OSM Planet file, with partial support for history files. It is based on a C++ library (libosmium) which can be used by developers to create new tools; Python bindings are also provided. Finally, OSM history can be explored and analysed using OSM Data Classification [99], which makes use of machine learning models to classify changesets and contributors.
Table 1 shows that, in line with the open and collaborative nature of OSM, almost all the software applications based on the OSM history are available under open source licenses. For each software included in the analysis, the Reference column of Table 1 includes also the link to the source code.
Implementation: Is OSM up-to-date?
The software application described in this paper is called “Is OSM up-to-date?”. According to the classification adopted in the previous section and shown in Table 1, it is a web application which makes use of the OSM API as the history source. It is released under the open source AGPL license with source code hosted on GitHub [100], a dedicated OSM wiki page [101] and a Web frontend [102]. In terms of aim, the web application belongs to the category of software providing visualization of OSM history. As a matter of fact, it generates history-based, quality-oriented visualizations of OSM nodes and ways having at least one tag for any rectangular user-selected region, which are suitable for OSM intrinsic quality assessment. The main target beneficiaries of “Is OSM up-to-date?” are OSM users, who need quality information on the data they want to use; OSM contributors and OSM communities, who need to quickly assess the quality of data in a given area to decide where mapping efforts should be best directed (e.g. where an on site survey or a mapping party [103] can be useful) and OSM researchers and scholars, who can use it as a tool to help in their OSM quality studies.
For these reasons, the application meets the following requirements:
-
Simple setup: being designed for the general (non-technical) public, the application shall be primarily accessed as a web app on an existing server; to use it on a personal server, a Docker container [104] shall be provided in order to reduce the amount of time spent in setting up and maintaining the system; finally, users shall be able to use the application as a regular command line tool with minimal external dependencies.
-
Ease of use: the web application shall not require user registration and shall have an intuitive user interface, well-known icons and a color palette which facilitates qualitative quality assessments.
-
Low requirements: the application shall not require to download big databases nor shall require additional computing power than the one provided by a regular desktop or smartphone device.
-
Compatibility with existing systems: the application shall produce outputs compatible with existing Geographic Information Systems (GIS) software using well-known formats.
“Is OSM up-to-date?” was developed to complement and enrich the set of available software implementations based on OSM history described in the previous section. In particular, to the authors’ knowledge it is the only software able to analyze the full history of a group of OSM objects located within a small portion of space without using the OSM Full History Planet File. The application incorporates some features available from the OSM website [64] and the web applications OSM Deep History [73] and OSM History Viewer by PeWu [74], e.g. the provision of history information for each selected object. “Is OSM up-to-date?” extends this information by computing and showing a comprehensive set of intrinsic quality measures for each OSM object: date of creation (first edit), date of last edit, number of versions (or revisions), number of different contributors who edited that object, and frequency of update. In addition, for each of these measures the web application provides quality-oriented map visualizations similar to those of OSM Latest Changes [81] involving all the objects included in a user-selected region. The same idea of a region-based intrinsic quality assessment is provided by QXOSM [85, 86], which however provides only aggregated analyses (i.e. without quality information on single objects) and does not generate quality-based map visualizations. By design, “Is OSM up-to-date?” only focuses on OSM nodes and ways. Relations are excluded for a number of reasons linked to their very nature: they are rarely used compared to nodes and ways [82]; almost all the edits made to a relation are edits to its members (which in turn consist almost exclusively of nodes and ways, whose intrinsic quality is already analysed); relations are also used to model very large objects (e.g. a lake or a country), thus they are not suitable for quality analyses on small, user-defined areas. Finally, as for the OSM website [64], also in “Is OSM up-to-date?” a new version of a node or way is counted as a result of a new changeset, independently of the number of edits to the geometry and/or tags. In other words, changesets where the sole geometry is edited or where the sole tags are edited or where both geometry and tags are edited, all correspond to one single new version of the node or way.
Technical overview
Figure 2 shows the architecture of “Is OSM up-to-date?”. It is composed of a backend written in Python 3, which fetches data from OSM servers using the OSM API, and a frontend, which can be either a web interface (web application) if users want to run the analyses online, or a command line interface if users want to download data for a specific region to perform further analyses offline, e.g. using GIS software. The software can be run inside a Python virtual environment (the dependencies are specified in the requirements.txt file) or inside a Docker container (which can be built from Dockerfile or downloaded from [105]). The application makes use of CircleCI [106] to build the Docker image and run a basic test. The backend and frontend of the application are separately presented in the following.

Technical architecture of “Is OSM up-to-date?”
Backend
Fetching data from the OSM API
“Is OSM up-to-date?” requires to get tagged OSM nodes and ways (including their history) in a specified bounding box. The number of requests to be done to the server using the official OSM API is equal to 1+N, where 1 corresponds to the request to the endpoint /api/0.6/map (using the parameter bbox) and N is the number of requests to be done to /api/0.6/{osm_type}/{feature_id}/history, which allows to retrieve the history of a specific OSM node or way identified by its id. Since the official openstreetmap.org server is used, the high number of requests to the OSM API (which can exceed one hundred even for a 1 km2 area) may require a lot of time to be processed and may be automatically blocked by the OSM server due to violation of the fair-usage policy [107]. This problem was solved using Dugong [108], a Python library which takes advantage of the HTTP 1.1 pipelining featureFootnote 1 to open a single HTTP connection with the server and reuse it for many different requests without closing it every time, thus reducing overhead and the time for fetching the data. The maximum number of requests allowed over a single connection is 100. This value was found empirically, since the OSM web server was found unable to reply to any additional request after the 100th has been made.
In addition to the previously mentioned external libraries, the software backend takes also advantage of the vast selection of Python built-in libraries, with 13 libraries importedFootnote 2.
Converting data into a SQLite database
A SQLite database [109] is used as an intermediate representation, because it allows to create complex queries to be run on the data without having to implement all the necessary procedures for the computationFootnote 3. OSM XML data is converted using the spatialite_osm_raw tool [110], which is part of the SpatiaLite [111] suite of tools.
Producing the data
A 42 lines long SQL queryFootnote 4 is executed using SpatiaLite to join the map with the history data and to produce a GeoJSON output thanks to the SQLite JSON1 extension [112], which is capable to handle JSON structures directly from the database.
Accessing the data
Transformed OSM data is finally exposed in the GeoJSON format through a simple REST API using the Python hug library [113], which also makes it easy to expose the functionality of the software via a command line interface.
Frontend
As already mentioned, the main frontend of “Is OSM up-to-date?” consists of a web interface showing qualitybased thematic map visualizations of tagged OSM nodes and ways on user-selected regions. The web interface is written using standard web technologies such as JavaScript, CSS and HTML 5. Additional libraries are used including the Leaflet mapping library [114] for the map widgets and Bootstrap [115] with jQuery [116] for layout, controls and popups. In addition, as mentioned above a command line interface is automatically generated by the Hug library, which exposes functions to HTTP and command line interfaces based on the definition of the main function, named getDataFootnote 5. The command line interface allows to use the software locally and save the GeoJSON output (i.e. OSM nodes and ways with their history-based quality parameters) for further GIS analysis. The way the web interface and the command line interface can be used is detailed in the next section.
Application
Web interface
The web interface of “Is OSM up-to-date?” is organized into a main map window featuring an OSM grayscale basemap and a menu at the top (see Figs. 3, 4, 5, 6 and 7). As said above, the web application produces quality-based thematic map visualizations of OSM nodes and ways according to the five criteria available in the left side of the top menu:
-
date of creation (first edit)
Fig. 3 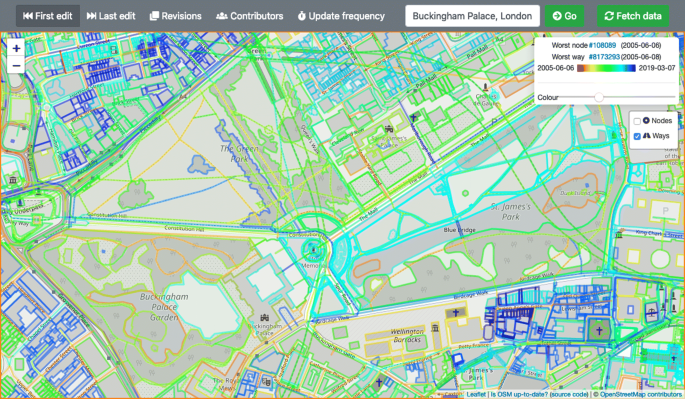
Classification of OSM ways in an area of London, UK, according to the date of first edit
Fig. 4 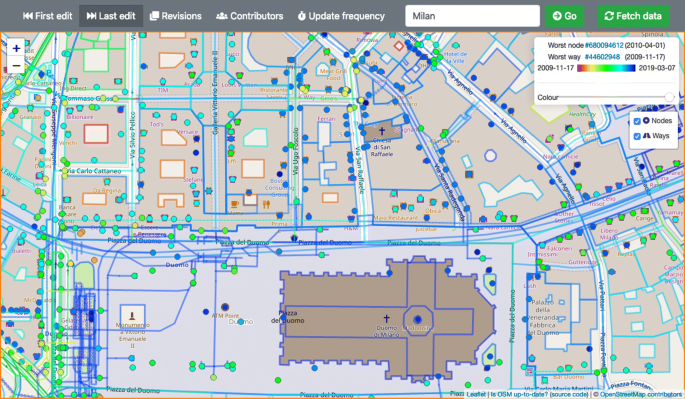
Classification of OSM nodes and ways in an area of Milan, Italy, according to the date of last edit
Fig. 5 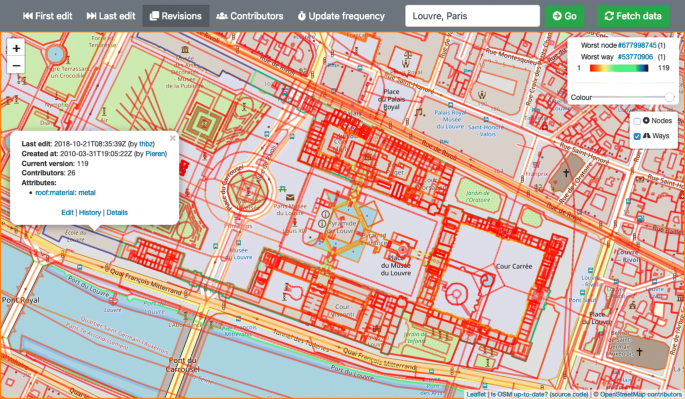
Classification of OSM ways in an area of Paris, France, according to the number of versions
Fig. 6 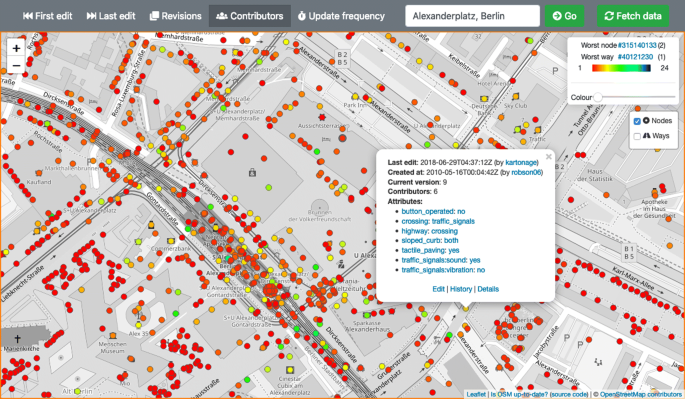
Classification of OSM nodes in an area of Berlin, Germany, according to the number of different contributors who edited them
Fig. 7 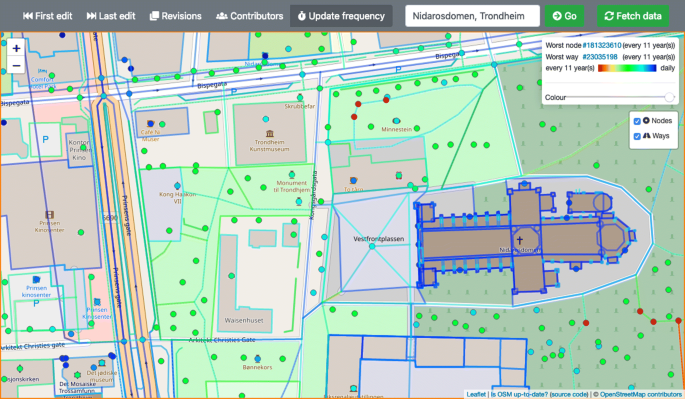
Classification of OSM nodes and ways in an area of Trondheim, Norway, according to the frequency of update
-
date of last edit
-
number of versions (revisions)
-
number of different contributors who edited that node or way
-
frequency of update


To browse the map to a specific location, users can either use the traditional zoom and pan commands or perform a search based on Nominatim [117] using the Search box in the top menu. Pressing the Fetch data button in the right side of the top menu, the OSM nodes and ways available in the current map view (retrieved in the GeoJSON format) are displayed on top of the basemap and coloured based on a rainbow scale ranging from the worst object (red color) to the best object (blue color) according to the selected quality criterion. Two elements to interact with the map are available in the upper right corner of the map view: a layer tree, which allows to turn on/off OSM nodes and ways, and a sliding bar to regulate the color of the basemap from the default grayscale (which enhances the visualization of nodes and ways) to the full-color version of OSM tiles. Finally, when an OSM node or way is clicked, a popup shows the following details retrieved from the OSM API (see Figs. 5 and 6):
-
timestamp of the last edit and OSM contributor responsible for it
-
timestamp of the first edit and OSM contributor responsible for it
-
number of versions
-
number of different contributors who edited that node or way
-
list of currently available tags (with clickable keys and values linked to the specific wiki pages of OSM keys and tags)
-
links to the OSM iD editor (in edit mode on that node or way), history and details of that node or way (both linked to the OSM website)
Figures 3, 4, 5, 6 and 7 show sample screenshots (all taken on March 7, 2019) of the web interface corresponding to the five quality criteria considered. Figure 3 shows the area surrounding Buckingham Palace in London, UK, where OSM ways are coloured according to their date of creation. The color legend in the upper right corner of the map view reveals that the first tagged way in this area (coloured in red) was created on June 6, 2005. Based on this legend, a visual analysis of the map clearly shows that the OSM development interested first the green areas around Buckingham Palace and some of the outside roads, and more recently moved to the built-up areas in the north, south-west and south-east of the region. Given the difference between the ids of OSM objects and the ids of real-world features discussed in “OSM data model and OSM history” section, a possible reason explaining the recent date of creation of the ways representing these buildings might be the recent subdivision of previous building blocks into individual buildings. Among the criteria considered, the date of creation is the one which, if taken alone, has the lowest implication on quality. As a matter of fact, the sole date of creation does not offer significant hints on the potential object quality. However, it can become highly meaningful when combined with other criteria such as the date of last edit or the number of different contributors. For example, an object created in 2005 and never updated afterwards may have a lower quality than an object created on the same date and recently updated by many contributors.
Figure 4 represents a section of the city center of Milan, Italy, where OSM nodes and ways are classified according to the date of last edit. This map proves the overall high quality of OSM in this area in terms of up-to-dateness, since most of the buildings (including Milan Cathedral), highways and points of interest have been updated recently. Up-to-dateness is one of the quality parameters where OSM (and crowdsourced geographic information in general) most typically outperforms authoritative data, which usually take years to be updated.
In Fig. 5 the OSM ways available in the area of the Louvre Museum in Paris, France, are classified based on the number of versions, i.e. the number of different revisions made so far to those ways. While most of the ways have undergone only one or few revisions, some have been heavily edited over time. The popup shown in Fig. 5 reveals a way (representing the outer perimeter of the Louvre) having a total of 119 versions. Clearly there is no guarantee that the higher is the number of versions, the higher is the real quality of an OSM object (i.e. its full correspondence to reality, in terms of both geometry and semantic information given by the tags). However, a considerable amount of edits might be indicative of a progressive update of the OSM object over time, and thus of a higher correspondence to reality – especially if the date of last update is also recent.
Figure 6 shows the OSM nodes in the surroundings of Alexanderplatz in Berlin, Germany, coloured according to the number of different contributors who have edited them over time. While a significant portion of the nodes have been created and subsequently edited by only one or few contributors, cases with multiple contributors editing the same node are not rare, as for the one shown with a popup in Fig. 6. Again, the quality of OSM objects might be high also in case only one or few contributors have edited it. Nevertheless, along the lines of Linus’s law that “given enough eyes, all bugs are shallow” [118], the presence of multiple volunteers was recognized as a mechanism for quality assurance of crowdsourced geographic information [9]. Thus, the number of different contributors who edited a single OSM object represents a valuable indicator of intrinsic quality.
Finally, Fig. 7 shows the classification of the OSM nodes and ways located in the area of Nidaros Cathedral in Trondheim, Norway, based on their frequency of update. This is computed as the ratio between the number of versions of the object and the time difference between the current date and the date of creation. As an example, the OSM objects shown in Fig. 7 feature an overall high frequency of update, mainly due to the fact that most OSM nodes and ways have been recently created and have already undergone a number of revisions (sometimes compressed in a limited timeframe, e.g. for the ways describing the cathedral). As it is for the number of versions and the number or different contributors, a high frequency of update is likely to correspond to a high quality.
Command line interface
Users interested in performing more quantitative analyses can use “Is OSM up-to-date?” from the command line, passing the coordinates of the bounding box as arguments. The program prints the GeoJSON content as standard output and offers a -r internal option allowing to be identified by the OSM server. The GeoJSON output includes all the OSM nodes and ways available in the selected bounding box, with the following attributes: id and username of the OSM user who made the last edit on the node or way; id of the node or way; timestamps of the first and the last edit on the node or way; number of versions of the node or way; current tags of the node or way; total number of different OSM contributors who edited the node or way and their usernames; frequency of update of the node or way.
A summary of the usage is the following:

An example of use is the following:

which saves the GeoJSON file result.geojson, an extract of which (retrieved on March 10, 2019) is the following:

Conclusions and future development
In addition to the amount, richness and detail of its content, the availability of historical information makes OSM a geospatial data source of unique interest to analyze for a wide variety of applications. Intrinsic assessments, including quality assessments, are the most popular ones. The open source web application “Is OSM up-to-date?”, presented in this paper, enriches the already broad set of software implementations focused on OSM history which are summarized in Table 1. The application was born from the need to provide OSM contributors, community leaders and researchers with an easy-to-use tool for quick and intuitive assessment of history-based OSM quality for specific regions. The basic idea is that the later the date of creation and of last edit, and the higher the number of versions, the number of different contributors and the frequency of updates of single OSM objects, the higher their quality might be. Clearly, these are only contingent and non-objective evaluations which may not correspond to reality. For example, an object which has been last updated earlier or less frequently than another might in reality be of higher quality. There is actually no doubt that some classes of OSM objects (e.g. building numbers) are often mapped once and rarely or never updated and still may be of high quality – since they usually do not change over time – while other classes of objects (e.g. points of interests such as commercial activities) are more often updated but still may be of low quality – since their details tend to change frequently. The extremes of each color scale in the web application should thus be interpreted not as absolute measures of quality, but as relative indications only limited to the quality parameter corresponding to that color scale. Therefore, “Is OSM up-to-date?” mainly allows to make qualitative considerations, which however may be very useful for purposes such as planning OSM mapping campaigns and understanding the temporal evolution of OSM in specific regions. Dealing with OSM history, the key difference between the permanent ids of real-world features and the ids of OSM objects (discussed in “OSM data model and OSM history” section) should be properly considered when using “Is OSM up-to-date?”. In fact, since under some circumstances this difference could lead to biased results, for each individual analysis it should be independently verified that it makes sense to assume that one real-world feature corresponds to exactly one OSM object.
As previously described, quantitative analyses are also possible using “Is OSM up-to-date?” from the command line interface to retrieve the whole dataset for a specific area and further process it in a GIS environment. The potential of the software was already ascertained by a number of communities to which it was presented, including the global [119], the USFootnote 6 and the Italian OSM communities [120].
Based on the feedback collected from the interaction with all these communities, a number of improvements are currently under evaluation for future development. In terms of functionality, to better assist users in performing assessments on specific (non-rectangular) areas, the option to upload a custom polygon, e.g. as a GeoJSON file, may be provided. Also, users may highly benefit from the chance to filter the visualization of OSM nodes and ways based on customized values for each of the quality criteria considered as well as from a combination of these filters, e.g. to extract only the objects created between two user-specified dates, having a minimum number of versions and being edited by a minimum number of different contributors. This improvement may be achieved by adding a set of sliders to the user interface. In addition to simple visualization, the download of OSM nodes and ways (with the related information for the quality criteria considered) available in the map area, which is currently possible only using the command line, may be also extended to the web application. Some improvements about styling and visualization of OSM nodes and ways are also under evaluation. First, nodes and ways are currently visualized through a linear color representation, i.e. with colors linearly distributed in the interval between red (for the worst value) and blue (for the best value) for each quality criterion. While intuitive and easy to understand also for non-expert users, this choice is not optimal for specific distributions of values for the considered parameters. Alternative or additional visualizations may be useful, e.g. based on quantiles/percentiles, on "equal counts" of values or on a logarithmic scale. In addition, to optimize the visualization of OSM nodes and ways, the use of color scales different from the current one is also under analysis. In fact, the rainbow color scale adopted has some disadvantages, including not being usable by colorblind people and providing a non-uniform, wavelength-dependent perception of color differences. Finally, for each specific visualization the color style may be also offered for download, e.g. in the QGIS QML or the Styled Layer Descriptor (SLD) formats.
“Is OSM up-to-date?” currently offers quality information for single OSM nodes and ways. A possible improvement consists in the computation and extraction of aggregated statistics (at least minimum, maximum, mean, median and standard deviation) for the set of nodes and ways available in the map area and for each of the quality criteria considered. Aggregated statistics may also include an analysis of OSM contributors, since their characteristics (e.g. the number of edits performed, the types of objects they create/edit the most, etc.), which are currently not considered in the application, can be another reliable proxy for the object quality.
Finally, from the more technical perspective the main limitation of “Is OSM up-to-date?” is the amount of data it can fetch and analyze at once, due to the constraints of the OSM API. This is the reason why the application can be currently used on areas including a reasonably limited number of OSM nodes and ways. Different APIs could mitigate the problem, but to fully overcome it the use and regular update of the OSM Full History Planet File would be required. However, this would be quite resource intensive and add further complexity to the software. In addition, as previously mentioned, the latest version of the Overpass API (v0.7.55, released on May 8, 2018) allows to retrieve the full history of any OSM object, thus removing the technical limitation that has bound to use the official OSM API (mainly meant for editing purposes rather than for reading or performing analyses). Switching to Overpass API would on the one hand simplify the code and reduce the number of API requests, but on the other hand it would return incomplete results since the whole history of OSM objects before late 2012 cannot be retrieved. Finally, representing many graphical elements in a browser can be resource intensive. In order to speed up some computations, WebAssembly [121] could replace some slow JavaScript functions using an HTML canvas element instead of adding many Scalable Vector Graphics (SVG) elements to the map. On this regard, a project such as rustwasm (Rust and WebAssembly) [122] would be an ideal candidate for the new code.
Availability and requirements
Project name Is OSM up-to-date?
Project homepage https://github.com/frafra/is-osm-uptodate
Operating system Platform independent
Programming languages Python, JavaScript, HTML, SQL
License GNU AGPLv3
Availability of data and materials
The software presented makes use of the OSM database, which is retrieved using the OSM API [37].
Notes
The new version of HTTP (HTTP 2) includes pipelining and there are many more libraries supporting it compared to HTTP 1.1, but the OSM web server does not yet support it.
asyncio, atexit, gzip, json, shlex, shutil, sqlite3, ssl, subprocess, tempfile, time, urllib, xml.etree
SQLite is probably the most widespread software in the world, as many programs - including browsers - use it internally as meta-file format
Abbreviations
- AGPL:
-
Affero General Public License
- API:
-
Application Programming Interface
- BSD:
-
Berkeley Software Distribution
- CC BY-SA:
-
Creative Commons Attribution-ShareAlike
- CSS:
-
Cascading Style Sheets
- GIS:
-
Geographic Information Systems
- GNU:
-
GNU’s Not Unix
- GPL:
-
General Public License
- HTML:
-
HyperText Markup Language
- HTTP:
-
Hypertext Transfer Protocol
- ISC:
-
Internet Systems Consortium
- JSON:
-
JavaScript Object Notation
- MIT:
-
Massachusetts Institute of Technology
- ODbL:
-
Open Database License
- OSM:
-
OpenStreetMap
- PBF:
-
Protocolbuffer Binary Format
- PD:
-
Public Domain
- SLD:
-
Styled Layer Descriptor
- SQL:
-
Structured Query Language
- SVG:
-
Scalable Vector Graphics
- WTFPL:
-
Do What The Fuck You Want To Public License
- XML:
-
eXtensible Markup Language
References
Foody G, Fritz S, Fonte CC, Bastin L, Olteanu-Raimond A-M, Mooney P, See L, Antoniou V, Liu H-Y, Minghini M, Vatseva R. Mapping and the Citizen Sensor In: Foody G, Fritz S, Mooney P, Olteanu-Raimond A-M, Fonte CC, Antoniou V, editors. Mapping and the Citizen Sensor. London: Ubiquity Press: 2017. p. 1–12.
OpenStreetMap Wiki - Main page. https://wiki.openstreetmap.org/w/index.php?title=Main_Page&oldid=1060762. Accessed 17 June 2019.
Open Data Commons. Open Database License (ODbL) v1.0. 2018. https://opendatacommons.org/licenses/odbl/1.0/index.html. Accessed 8 Dec 2018.
OpenStreetMap stats report. https://www.openstreetmap.org/stats/data_stats.html. Accessed 15 June 2019.
OpenStreetMap Blog. 1 million map contributors!. https://blog.openstreetmap.org/2018/03/18/1-million-map-contributors. Accessed 8 Dec 2018.
Mooney P, Minghini M. A Review of OpenStreetMap Data In: Foody G, Fritz S, Mooney P, Olteanu-Raimond A-M, Fonte CC, Antoniou V, editors. Mapping and the Citizen Sensor. London: Ubiquity Press: 2017. p. 37–59.
Jokar Arsanjani J, Zipf A, Mooney P, Helbich M. OpenStreetMap in GIScience In: Jokar Arsanjani J, Zipf A, Mooney P, Helbich M, editors. Cham: Springer: 2015. p. 1–15.
Sehra S, Singh J, Rai H. Using Latent Semantic Analysis to Identify Research Trends in OpenStreetMap. ISPRS Int J Geo-Inf. 2017; 6(7):195.
Goodchild MF, Li L. Assuring the quality of volunteered geographic information. Spat Stat. 2012; 1:110–20.
Veregin H. Data quality parameters. In: Geographical Information Systems. Hoboken, New Jersey: John Wiley & Sons: 1999. p. 177–189.
Devillers R, Jeansoulin R. Spatial data quality: concepts. Hoboken: Wiley Online Library; 2010, pp. 31–42.
International Organization for Standardization. ISO 19157:2013 Geographic Information — Data quality. 2013. http://www.iso.org/iso/home/store/catalogue_ics/catalogue_detail_ics.h%tm?csnumber=32575. Accessed 8 Dec 2018.
Haklay M. How good is volunteered geographical information? A comparative study of OpenStreetMap and Ordnance Survey datasets. Environ Plan B: Plan Des. 2010; 37(4):682–703.
Canavosio-Zuzelski R, Agouris P, Doucette P. A photogrammetric approach for assessing positional accuracy of OpenStreetMapⒸ roads. ISPRS Int J Geo-Inf. 2013; 2(2):276–301.
Graser A, Straub M, Dragaschnig M. Is osm good enough for vehicle routing? a study comparing street networks in vienna. In: Progress in Location-Based Services 2014. Cham: Springer: 2015. p. 3–17.
Brovelli MA, Minghini M, Molinari M, Mooney P. Towards an automated comparison of OpenStreetMap with authoritative road datasets. Trans GIS. 2017; 21(2):191–206.
Barrington-Leigh C, Millard-Ball A. The world’s user-generated road map is more than 80% complete. PLOS ONE. 2017; 12(8):0180698.
Hecht R, Kunze C, Hahmann S. Measuring completeness of building footprints in OpenStreetMap over space and time. ISPRS Int J Geo-Inf. 2013; 2(4):1066–1091.
Fan H, Zipf A, Fu Q, Neis P. Quality assessment for building footprints data on OpenStreetMap. Int J Geogr Inf Sci. 2014; 28(4):700–19.
Fram C, Chistopoulou K, Ellul C. Assessing the quality of openstreetmap building data and searching for a proxy variable to estimate osm building data completeness. In: Proceedings of the GIS Research UK (GISRUK): 2015. p. 195–205.
Brovelli MA, Minghini M, Molinari ME, Zamboni G. International Archives of the Photogrammetry, Remote Sensing and Spatial Information Sciences. 2016; 41:615–20.
Estima J, Painho M. Investigating the potential of openstreetmap for land use/land cover production: A case study for continental portugal. In: OpenStreetMap in GIScience. Cham: Springer: 2015. p. 273–293.
Jokar Arsanjani J, Mooney P, Zipf A, Schauss A. Quality assessment of the contributed land use information from openstreetmap versus authoritative datasets. In: OpenStreetMap in GIScience. Cham: Springer: 2015. p. 37–58.
Fonte CC, Patriarca JA, Minghini M, Antoniou V, See L, Brovelli MA. Using openstreetmap to create land use and land cover maps: Development of an application. In: Volunteered Geographic Information and the Future of Geospatial Data. Hershey, Pennsylvania: IGI Global: 2017. p. 113–137.
Girres J-F, Touya G. Quality assessment of the French OpenStreetMap dataset. Trans GIS. 2010; 14(4):435–459.
Jackson SP, Mullen W, Agouris P, Crooks A, Croitoru A, Stefanidis A. Assessing completeness and spatial error of features in volunteered geographic information. ISPRS Int J Geo-Inf. 2013; 2(2):507–530.
Antoniou V, Skopeliti A. Measures and indicators of VGI quality: An overview, Vol. II-3/W5; 2015. pp. 345–351.
OpenStreetMap Wiki - API changes between v0.5 and v0.6.https://wiki.openstreetmap.org/w/index.php?title=API_changes_between_v0.5_and_v0.6&oldid=1695086. Accessed 15 June 2019.
OpenStreetMap Wiki - Elements. https://wiki.openstreetmap.org/w/index.php?title=Elements&oldid=1479648. Accessed 17 June 2019.
Ramm F, Topf J, Chilton S. OpenStreetMap: Using and Enhancing the Free Map of the World. Cambridge: UIT; 2010.
OpenStreetMap Wiki - Permanent ID. https://wiki.openstreetmap.org/w/index.php?title=Permanent_ID&oldid=1642812. Accessed 15 June 2019.
OpenStreetMap Wiki - Tags. https://wiki.openstreetmap.org/w/index.php?title=Tags&oldid=1839489. Accessed 17 June 2019.
OpenStreetMap Wiki - Map Features. https://wiki.openstreetmap.org/w/index.php?title=Map_Features&oldid=1819914. Accessed 17 June 2019.
Ballatore A, Mooney P. Conceptualising the geographic world: the dimensions of negotiation in crowdsourced cartography. Int J Geogr Inf Sci. 2015; 29(12):2310–27.
Taginfo. https://taginfo.openstreetmap.org. Accessed 2 Jan 2019.
OpenStreetMap Wiki - Changeset. https://wiki.openstreetmap.org/w/index.php?title=Changeset&oldid=1576566. Accessed 17 June 2019.
OpenStreetMap Wiki - API. https://wiki.openstreetmap.org/w/index.php?title=API&oldid=1782017. Accessed 17 June 2019.
OpenStreetMap Wiki - Overpass API. https://wiki.openstreetmap.org/w/index.php?title=Overpass_API&oldid=1859960. Accessed 17 June 2019.
OpenStreetMap Wiki - Overpass turbo. https://wiki.openstreetmap.org/w/index.php?title=Overpass_turbo&oldid=1845507. Accessed 17 June 2019.
Sliced Time and Space. https://dev.overpass-api.de/blog/sliced_time_and_space.html. Accessed 2 Mar 2019.
Creative Commons. Attribution-ShareAlike 2.0 Generic (CC BY-SA 2.0). 2012. https://creativecommons.org/licenses/by-sa/2.0/. Accessed 16 June 2019.
OpenStreetMap Wiki - Higa4/License. https://wiki.openstreetmap.org/w/index.php?title=Higa4/License&oldid=1465044. Accessed 16 June 2019.
OpenStreetMap Wiki - Planet.osm/full. https://wiki.openstreetmap.org/w/index.php?title=Planet.osm/full&oldid=1661018. Accessed 17 June 2019.
Planet_OSM. https://planet.openstreetmap.org/planet/full-history. Accessed 16 June 2019.
OpenStreetMap Wiki - API changes between v0.4 and v0.5.https://wiki.openstreetmap.org/w/index.php?title=API_changes_between_v0.4%_and_v0.5&oldid=1499007. Accessed 16 June 2019.
Ciepłuch B, Mooney P, Winstanley AC. Building generic quality indicators for openstreetmap. In: Proceedings of the GIS Research UK 19th Annual Conference (GISRUK 2011).2011.
Keßler C, De Groot RTA. Trust as a proxy measure for the quality of volunteered geographic information in the case of openstreetmap In: Vandenbroucke D, Bucher B, Joep C, editors. Geographic Information Science at the Heart of Europe. Cham: Springer: 2013. p. 21–37.
Muttaqien B. I., Ostermann F. O., Lemmens R. L. G.Modeling aggregated expertise of user contributions to assess the credibility of OpenStreetMap features. Trans GIS. 2018; 22(3):823–41.
Mooney P, Corcoran P. Analysis of Interaction and Co-editing Patterns amongst OpenStreetMap Contributors: Analysis of Interaction and Co-editing Patterns amongst OpenStreetMap Contributors. Transactions in GIS. 2014; 18(5):633–59.
Gröchenig S, Brunauer R, Rehrl K. Estimating completeness of vgi datasets by analyzing community activity over time periods In: Huerta J, Schade S, Granell C, editors. Connecting a Digital Europe Through Location and Place. Cham: Springer: 2014. p. 3–18.
Nasiri A, Ali Abbaspour R, Chehreghan A, Jokar Arsanjani J. Improving the Quality of Citizen Contributed Geodata through Their Historical Contributions: The Case of the Road Network in OpenStreetMap. ISPRS Int J Geo-Inf. 2018; 7(7):253.
Barron C, Neis P, Zipf A. A Comprehensive Framework for Intrinsic OpenStreetMap Quality Analysis: A Comprehensive Framework for Intrinsic OpenStreetMap Quality Analysis. Trans GIS. 2014; 18(6):877–95.
Corcoran P, Mooney P, Bertolotto M. Analysing the growth of OpenStreetMap networks. Spat Stat. 2013; 3:21–32.
Neis P, Zielstra D, Zipf A. The Street Network Evolution of Crowdsourced Maps: OpenStreetMap in Germany 2007–2011. Futur Int. 2011; 4(1):1–21.
Zhao P, Jia T, Qin K, Shan J, Jiao C. Statistical analysis on the evolution of OpenStreetMap road networks in Beijing. Physica A: Stat Mech Appl. 2015; 420:59–72.
Hacar M, Kılıç B, Şahbaz K.Analyzing OpenStreetMap Road Data and Characterizing the Behavior of Contributors in Ankara, Turkey. ISPRS Int J Geo-Inf. 2018; 7(10):400.
Tian Y, Zhou Q, Fu X. An Analysis of the Evolution, Completeness and Spatial Patterns of OpenStreetMap Building Data in China. ISPRS Int J Geo-Inf. 2019; 8(1):35.
Jokar Arsanjani J, Helbich M, Bakillah M, Loos L. The emergence and evolution of OpenStreetMap: a cellular automata approach. Int J Digit Earth. 2015; 8(1):76–90.
Minghini M, Brovelli MA, Frassinelli F. ISPRS - Int Arch Photogramm Remote Sens Spat Inf Sci. 2018; XLII-4/W8:147–54.
Sehra S, Singh J, Rai H. Assessing OpenStreetMap data using intrinsic quality indicators: an extension to the QGIS processing toolbox. Futur Internet. 2017; 9(2):15.
Dittus M, Quattrone G, Capra L. Mass Participation During Emergency Response: Event-centric Crowdsourcing in Humanitarian Mapping. In: Proceedings of the 2017 ACM Conference on Computer Supported Cooperative Work and Social Computing - CSCW ’17. New York: ACM Press: 2017. p. 1290–303.
Minghini M, Sarretta A, Lupia F, Napolitano M, Palmas A, Delucchi L. Collaborative mapping response to disasters through OpenStreetMap: the case of the 2016 Italian earthquake. GEAM - GeoEng Environ Min. 2017; 151(2):21–6.
Auer M, Eckle M, Fendrich S, Griesbaum L, Kowatsch F, Marx S, Raifer M, Schott M, Troilo R, Zipf A. Towards Using the Potential of OpenStreetMap History for Disaster Activation Monitoring. In: Proceedings of the 15th ISCRAM Conference: 2018. p. 317–25.
OpenStreetMap website. https://openstreetmap.org. Accessed 3 Feb 2019.
Achavi. https://overpass-api.de/achavi/. Accessed 2 Feb 2019.
OSMatrix. http://koenigstuhl.geog.uni-heidelberg.de/osmatrix/. Accessed 2 Feb 2019.
Roick O, Hagenauer J, Zipf A. OSMatrix–grid-based analysis and visualization of OpenStreetMap. In: Proceedings of State of the Map Europe 2011: 2011. p. 44–54.
OSM History Explorer. https://ohsome.org/apps/osm-history-explorer/. Accessed 16 June 2019.
oshome. https://ohsome.org. Accessed 8 June 2019.
OSMCha. https://osmcha.mapbox.com/. Accessed 2 Feb 2019.
OSMCha source code. https://github.com/willemarcel/osmcha. Accessed 2 Feb 2019.
Who did it?. https://simon04.dev.openstreetmap.org/whodidit/. Accessed 2 Feb 2019.
OSM Deep History. https://osmlab.github.io/osm-deep-history/. Accessed 2 Feb 2019.
OSM History Viewer by PeWu. https://pewu.github.io/osm-history/. Accessed 2 Feb 2019.
OpenStreetMap History Renderer source code. https://github.com/MaZderMind/osm-history-renderer. Accessed 3 Feb 2019.
Visualize Change. https://visualize-change.hotosm.org. Accessed 2 Feb 2019.
OSM History Viewer. https://wiki.openstreetmap.org/w/index.php?title=OSM_History_Viewer&oldid%=1711101. Accessed 17 June 2019.
Show me the way. https://osmlab.github.io/show-me-the-way/. Accessed 2 Feb 2019.
OSMvis. https://osm-vis.geog.uni-heidelberg.de/. Accessed 2 Feb 2019.
Mocnik F-B, Mobasheri A, Zipf A. Open source data mining infrastructure for exploring and analysing OpenStreetMap. Open Geospatial Data Softw Stand. 2018; 3(7).
OSM Latest changes. https://osmlab.github.io/latest-changes/. Accessed 7 June 2019.
OpenStreetMap Wiki - Stats. https://wiki.openstreetmap.org/w/index.php?title=Stats&oldid=1859168. Accessed 17 June 2019.
OSMstats. https://osmstats.neis-one.org. Accessed 16 June 2019.
How did you contribute to OpenStreetMap?. http://hdyc.neis-one.org/. Accessed 2 Feb 2019.
QXOSM. http://xosm.ual.es:8080/qxosm/. Accessed 2 Feb 2019.
Almendros-Jiménez J., Becerra-Terón A.Analyzing the Tagging Quality of the Spanish OpenStreetMap. ISPRS Int J Geo-Inf. 2018; 7(8).
OSM stats by Steve Coast. https://osmstats.stevecoast.com. Accessed 2 Feb 2019.
Tag history. http://taghistory.raifer.tech. Accessed 2 Feb 2019.
Brave Mappers. http://mvexel.github.io/bravemappers/. Accessed 2 Feb 2019.
OSM Analytics. https://osm-analytics.org. Accessed 2 Feb 2019.
OSM LiveChanges. http://live.openstreetmap.fr/. Accessed 2 Feb 2019.
Oshome Dashboard. https://ohsome.org/apps/dashboard/. Accessed 16 June 2019.
Raifer M, Troilo R, Kowatsch F, Auer M, Loos L, Marx S, Przybill K, Fendrich S, Mocnik F-B, Zipf A. A framework for spatio-temporal analysis of OpenStreetMap history data. Open Geospatial Data Softw Stand. 2019; 4(3):1–12.
OSMesa. https://www.azavea.com/research-projects/osmesa/. Accessed 3 Feb 2019.
EPIC-OSM. http://project-epic.github.io/epic-osm. Accessed 3 Feb 2019.
OSM PBF Foreign Data Wrapper source code. https://github.com/vpikulik/postgres_osm_pbf_fdw. Accessed 3 Feb 2019.
OSM Parquetizer source code. https://github.com/adrianulbona/osm-parquetizer. Accessed 3 Feb 2019.
Osmium source code. https://github.com/osmcode/. Accessed 3 Feb 2019.
OSM Data Classification source code. https://github.com/Oslandia/osm-data-classification. Accessed 3 Feb 2019.
Is OSM up-to-date? source code. https://github.com/frafra/is-osm-uptodate. Accessed 20 June 2019.
OpenStreetMap Wiki - Is OSM up-to-date. https://wiki.openstreetmap.org/w/index.php?title=Is_OSM_up-to-date&oldid=%1865885. Accessed 20 June 2019.
Is OSM up-to-date?. https://is-osm-uptodate.frafra.eu. Accessed 20 June 2019.
Mooney P, Minghini M, Stanley-Jones F. Observations on an OpenStreetMap mapping party organised as a social event during an open source GIS conference. Int J Spat Data Infrastruct Res. 2015; 10:138–50.
Docker. https://www.docker.com/. Accessed 2 Mar 2019.
Is OSM up-to-date? on Docker Hub. https://hub.docker.com/r/frafra/is-osm-uptodate. Accessed 20 June 2019.
CircleCI. https://circleci.com/. Accessed 20 June 2019.
OSMF Operations Working Group. API Usage policy. https://operations.osmfoundation.org/policies/api/. Accessed 5 Mar 2019.
Dugong. https://github.com/python-dugong/python-dugong. Accessed 5 Mar 2019.
SQLite. https://www.sqlite.org. Accessed 16 June 2019.
SpatiaLite OSM tools. https://www.gaia-gis.it/fossil/spatialite-tools/wiki?name=OSM+tools. Accessed 6 Mar 2019.
SpatiaLite. https://www.gaia-gis.it/fossil/libspatialite/. Accessed 6 Mar 2019.
The JSON1 Extension. https://www.sqlite.org/json1.html. Accessed 6 Mar 2019.
Hug. http://www.hug.rest/. Accessed 6 Mar 2019.
Leaflet. https://leafletjs.com/. Accessed 6 Mar 2019.
Bootstrap. https://getbootstrap.com/. Accessed 6 Mar 2019.
jQuery. https://jquery.com/. Accessed 6 Mar 2019.
Nominatim. https://nominatim.openstreetmap.org/. Accessed 6 Mar 2019.
Raymond ES. The Cathedral and the Bazaar: Musings on Linux and Open Source. Sebastopol: O’Reilly Media; 1999.
Frassinelli F, Minghini M, Brovelli MA. Intrinsic assessment of the temporal accuracy, up-to-dateness, lineage and thematic accuracy of OpenStreetMap. In: Presentations of State of the Map 2018, Milan (Italy), July 28-30, 2018: 2018.
Frassinelli F, Minghini M, Brovelli MA. Un approccio open source per la valutazione intrinseca di accuratezza tematica, accuratezza temporale, aggiornamento e lignaggio di osm. In: Presentations of FOSS4G-IT 2018, Rome (Italy), February 19-22, 2018: 2018.
WebAssembly. https://webassembly.org. Accessed 18 Mar 2019.
Rust and WebAssembly. https://rustwasm.github.io. Accessed 18 Mar 2019.
OpenStreetMap website source code. https://github.com/openstreetmap/openstreetmap-website. Accessed 2 Feb 2019.
Achavi source code. https://github.com/nrenner/achavi/. Accessed 2 Feb 2019.
OSM Deep History source code. https://github.com/osmlab/osm-deep-history. Accessed 2 Feb 2019.
OSM History Viewer source code. https://github.com/osmrmhv/osmrmhv. Accessed 2 Feb 2019.
OSM History Viewer by PeWu source code. https://github.com/PeWu/osm-history. Accessed 2 Feb 2019.
OSMatrix source code. https://github.com/GIScience/osmatrix. Accessed 2 Feb 2019.
OSMvis source code. https://github.com/mocnik-science/osm-vis. Accessed 2 Feb 2019.
Show me the way source code. https://github.com/osmlab/show-me-the-way. Accessed 2 Feb 2019.
Visualize Change source code. https://github.com/hotosm/visualize-change. Accessed 2 Feb 2019.
Who did it? source code. https://github.com/simon04/whodidit. Accessed 2 Feb 2019.
OSM Latest changes source code. https://github.com/osmlab/latest-changes. Accessed 7 June 2019.
OSM stats backend by Steve Coast. https://gitlab.com/CoastHeavyIndustries/OSM-stats. Accessed 2 Feb 2019.
OSM stats frontend by Steve Coast. https://gitlab.com/CoastHeavyIndustries/OSM-stats-frontend. Accessed 2 Feb 2019.
Tag history source code. https://github.com/tyrasd/taghistory. Accessed 2 Feb 2019.
Brave Mappers source code. https://github.com/mvexel/bravemappers/. Accessed 2 Feb 2019.
iOSMAnalyzer source code. https://github.com/zehpunktbarron/iOSMAnalyzer. Accessed 3 Feb 2019.
OSM Analytics source code. https://github.com/hotosm/osm-analytics. Accessed 2 Feb 2019.
OSM LiveChanges source code. https://github.com/cstenac/osm-livechanges. Accessed 2 Feb 2019.
EPIC-OSM source code. https://github.com/Project-EPIC/epic-osm. Accessed 3 Feb 2019.
OSHDB source code. https://github.com/giscience/oshdb. Accessed 2 Feb 2019.
OSMesa source code. https://github.com/azavea/osmesa. Accessed 3 Feb 2019.
Osmium tool source code. https://github.com/osmcode/osmium-tool. Accessed 7 Jun 2019.
Acknowledgements
The authors would like to thank the anonymous reviewers for their pertinent and constructive comments which have helped improve the paper.
Author information
Authors and Affiliations
Contributions
MM and FF conceived the software idea; FF developed the software; MM wrote Section 1; MM wrote Section 2; MM and FF wrote Section 3; MM and FF wrote Section 4; MM and FF wrote Section 5; MM wrote Section 6. All authors read and approved the final manuscript.
Corresponding author
Ethics declarations
Competing interests
The views expressed are purely those of the authors and may not in any circumstances be regarded as stating an official position of the European Commission. The authors declare that they have no competing interests.
Additional information
Publisher’s Note
Springer Nature remains neutral with regard to jurisdictional claims in published maps and institutional affiliations.
The views expressed are purely those of the authors and may not in any circumstances be regarded as stating an official position of the European Commission.
Rights and permissions
Open Access This article is distributed under the terms of the Creative Commons Attribution 4.0 International License(http://creativecommons.org/licenses/by/4.0/), which permits unrestricted use, distribution, and reproduction in any medium, provided you give appropriate credit to the original author(s) and the source, provide a link to the Creative Commons license, and indicate if changes were made.
About this article

Cite this article
Minghini, M., Frassinelli, F. OpenStreetMap history for intrinsic quality assessment: Is OSM up-to-date?. Open geospatial data, softw. stand. 4, 9 (2019). https://doi.org/10.1186/s40965-019-0067-x
Received:
Accepted:
Published:
DOI: https://doi.org/10.1186/s40965-019-0067-x