- Software
- Open access
- Published:
PyWPS: overview, new features in version 4 and existing implementations
Open Geospatial Data, Software and Standards volume 4, Article number: 13 (2019)
Abstract
PyWPS 4 is a re–make of the Python implementation of the WPS standard. It is the result of the work of over a dozen individual contributors, during a period of almost three years. One of the goals driving this re–implementation was to embrace modern Python technologies and the possibilities they open.This technical note reviews some of the more advanced possibilities this new PyWPS implementation opens. Request activity is now logged into a structured database, relying on a generic Object–Relational Mapping engine. The adoption of WSGI (Web Server Gateway Interface) opens new ways for load balancing request execution and application encapsulation, that are exemplified with modern Python technologies. Furthermore, PyWPS 4 is designed with containerisation in mind, expediting both development and deployment and improving security.
Introduction
The Web Processing Service (WPS) is a standard developed by the Open Geospatial Consortium (OGC), whose purpose is the remote execution of geospatial processes. WPS does not define what is a geospatial process but rather how operations are described, executed and processed in the server [1]. The standard is comparable to other remote execution systems like RPC (Remote Procedure Call).
PyWPS was one of the first server side implementations of the WPS standard. Development started in 2006 by Jáchym Čepický as part of a student project entitled “Connecting of GRASS GIS with UMN MapServer”, supported by the German Foundation for the Environment, and later with a scholarship from GDF–Hannover. The broad goals of PyWPS were the integration, publication and execution of Python processes via version 1.0 of the WPS standard. PyWPS evolved as a light–weight server, fully coded in the Python programming language, connecting to all existing tools for geospatial data analysis in this language.
From the onset, PyWPS was conceived to offer the simplest publication mechanism possible. A process served by PyWPS is no more than a Python class inheriting from the Process, which collects the necessary properties to convey the process meta–data, plus a method named _handler. At run–time this method provides through is arguments an object encapsulating the request received by the server (request) and another (response) through which process results can be set for return. Listing ?? presents a simple example with the use of the _handler method and its arguments. With such setting, developing a process for PyWPS thus requires no additional knowledge beyond that of the Python language itself and the core concepts of the WPS standard. This makes PyWPS accessible to individuals lacking advanced training in programming, such as spatial analysts or researchers.
PyWPS itself does not provide the processing functionality. It should be considered as an empty envelope, offering simple interfaces to WPS inputs and outputs. A typical user of PyWPS is a system administrator or scientist wishing to expose (geospatial) calculations to the World Wide Web (WWW). Each process should represent a unique operation on the input data and provide a well defined output. Part of the work required from the user is the definition of these inputs and outputs.

In its earlier formulations, PyWPS offered also a tight integration with MapServer, allowing the user to publish results directly through a Web Feature Service (WFS) or Coverage Service for the Web (CSW). This feature, coupled with the ease of use, promoted the adoption of PyWPS. By the beginning of this decade, PyWPS was being routinely used in research projects [2, 3]. As it reached a decade old, PyWPS was starting to show its age. New geospatial bindings were becoming available for the Python language, security concerns were being raised on the way PyWPS spawned processes, and a new release of the WPS standard was on its way.
By 2015 a new implementation of the WPS standard was initiated from scratch by the development team. Development would take almost three years and involved over a dozen of different contributors. The end result is PyWPS 4 [4], a fresh implementation of WPS version 1.0 that addresses various changes and trends forming in the geospatial Python community: the increasing adoption of Python 3, the release of bindings to other open source projects (e.g. GRASS GIS) and the introduction of new geospatial data formats, such as GeoPackage or GeoJSON. PyWPS 4 also prompts a switch from the GPL licence [5] to the more permissive MIT licence [6].
The improvements introduced by PyWPS 4 include: the adoption of the C–based lxml module [7] for XML parsing; adoption of the Python multiprocessing module [8] to treat asynchronous requests; integration of the OWSLib [9] package for special geospatial objects, like bounding boxes; introduction of a four level input validation mechanism; introduction of custom input validators. With these developments PyWPS comes to rely more on state–of–the–art Python libraries benefiting from their active development and the communities around them. A further outcome is a more modular and easier to maintain code base.
By the time development of PyWPS 4 was starting, the process of graduation by the Open Source Geospatial Foundation (OSGeo) was also initiated. OSGeo is a not–for–profit organisation whose mission is to foster global adoption of open geo–spatial technology, driven by participatory principles and a philosophy of community development. OSGeo has set in place a graduation process, designed to assure the quality, legal conformance and long term sustainability of open–source geospatial projects [10]. Only those projects that complete the graduation process are promoted for global adoption. Graduated projects also become eligible for various support mechanisms.
Towards that end, the lead developers of PyWPS assembled a Project Steering Committee (PSC). The PSC is the formal governance organ of an OSGeo project, begin responsible for the broad development direction of the project and the bureaucratic and administrative obligations tied to the OSGeo graduation. The PSC included a project mentor assigned by OSGeo, another consequence of the graduation procedure. After meeting the strict criteria set by OSGeo, PyWPS officially graduated in May of 2018 [11], already after the official release of PyWPS 4.
Beyond the improvements mentioned above, this new PyWPS implementation also provides a number of advanced features that present an important leap in the range of modes PyWPS can be used and deployed. This article starts by reviewing several advanced features (“Advanced features in PyWPS 4” section: Logging Using Object–Relational Mapping, Scalability with WSGI and Containerisation). Afterwards, “Comparison with other WPS servers” section compares PyWPS with two other OSGeo graduated WPS servers: GeoServer and ZOO–Project; “PyWPS use cases” section follows, with an account of various real–life use cases of PyWPS; “Summary and future developments” section summarises the article and provides notes on future developments.
Advanced features in PyWPS 4
Logging using Object–Relational Mapping
Earlier PyWPS versions used the Python logging module to support the recording of messages into a text file, be it from the server itself or from user processes in execution. Although simple, this mechanism was convenient enough for development purposes, within an environment where a single user issues requests to PyWPS. However, in production environments this kind of activity produced an ever expanding file from which it could become hard to extract information, especially when multiple requests were executed simultaneously.
PyWPS 4 introduces a new logging mechanism, supported by a database where requests to the server and process execution statuses are thoroughly recorded. This mechanism is based on the SQLAlchemy Object–Relation Mapping (ORM) module [12], which abstracts a large number of different database technologies. SQLAlchemy provides a simple and largely intuitive API to what is a rather powerful toolbox. In the service configuration file [13], it is now possible to set the location and kind of database engine to use. Listing ?? provides an example, the first three elements concern a simple text file that is used to store error messages, while the fourth sets the connection string to be passed on to SQLAlchemy. At start up, PyWPS connects to the database and creates two tables, one to store execution statuses and another to store requests.

With this new set up, the user not only gains systematic monitoring means, but also a whole new range of methods to store logs. Using the appropriate connection string (possibly including authentication), logs may be stored to a database hosted by a full featured database management system, such as PostgreSQL, Oracle, Firebird or MariaDB. Log maintenance and querying thus becomes considerably more structured and convenient. Alternatively, either for debugging purposes, or to spare hard disk interaction, the user may opt for a volatile in–memory database, using a connection string such as sqlite:///:memory:.
Beyond logging, the database is also used internally by PyWPS. The requests table functions as a queue, buffering execution when the number of requests exceeds the number of processing units available. In such cases, PyWPS waits for a processing unit to be available; it then serves the oldest request waiting in the queue.
Scalability using WSGI
Contrary to its predecessors, PyWPS 4 is no longer a directly executable service, but rather a Python module to be used in a Web Server Gateway Interface (WSGI) application that implements user processes. Two reference applications are provided for PyWPS 4: pywps-flask [14], based on the micro–framework Flask [15], and pywps-django [16], based on the feature rich, and heavier, Django [17]; both application frameworks are WSGI compliant.
Flask is a convenient framework to implement PyWPS 4 instances, but it comes at the expense of scalability. Flask does not support concurrency and may reject requests if these are received when a previous request is still being processed. While this may not be an issue in development, at face value Flask comes across as unsuitable for production environments. However, making use of WSGI servers, Flask can be spawn and managed into multiple threads or processes, increasing concurrency. Using a server with WSGI support, wider possibilities regarding security, scalability and load balancing become available – capital concerns when deploying a PyWPS server to a production environment.
A reference PyWPS 4 set–up was developed, encapsulating the server within three layers (Fig. 1):
-
Application – where requests are actually processed.
Fig. 1 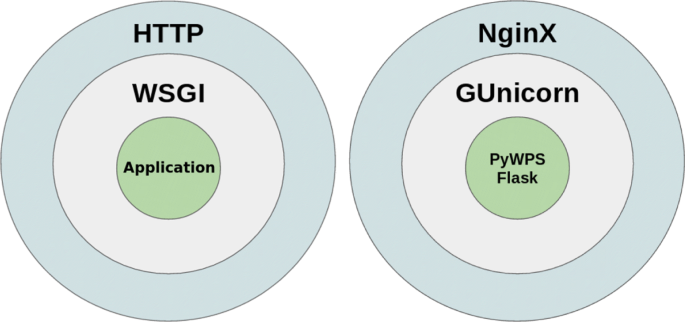
The various functional layers encapsulating a WSGI application and the technologies employed in PyWPS 4
-
WSGI – bearing concurrency.
-
HTTP – providing security insulation.

In the inner application level lay the functionalities that translate requests into objects tractable by PyWPS and user processes (the work of Flask or Django); at this level no concerns with concurrency or scalabily exist, the application is taken as fully self–contained. The intermediate WSGI layer is set–up with Gunicorn [18], providing concurrency by spawning system processes for the requests received. The outer HTTP layer is provided by an HTTP server like the NginX web server [19], that additionally furnishes reverse–proxy functionalities, security and load balancing. This proposal is not meant to be a panacea, but rather a template showcasing deployment practices with modern technologies. Users are free to employ alternative technologies in each of these layers, adjusting the set–up to their specific needs.
Containerisation
While in its basic realisation with Flask PyWPS 4 still provides the easy and approachable WPS server of its predecessors, the reference set–up with Gunicorn and Ngin might be too hurdling to certain users. Especially so to researchers lacking formal training in computer sciences, that simply wish to deploy their model(s) to the WWW. With this in mind, the PyWPS team has made publicly available containerised versions of various reference set–ups [20] using the Docker technology [21]. Each of these containerised set–ups demonstrate the deployment of PyWPS with different WSGI application frameworks and different HTTP servers. Other set–ups based on these initial proposals have been made public by the communityFootnote 1, further attesting to the deployment flexibility achieved with PyWPS 4.
Using one (or more) of these reference containers, users may develop their processes within an easeful framework like Flask and then seamlessly deploy them to a previously set–up, full fledged production server. For instance, a development or testing environment can be set up only with Flask, whereas a production container may include all necessary components, e.g. Gunicorn and NginX.
The employment of containers for testing and developing purposes sets the theme for various developments that will too rely on the Docker technology. An extension to PyWPS allowing processes themselves to be containerised has been developed as a Master’s thesis [22] and is presently in the final stages of integration. Containerisation implies that an Execute request results in the spawning of an ad hoc container in which the corresponding process is executed in a sand–boxed environment. This way process execution is kept largely isolated from the host system. Two important advantages emerge from this extension: first is the increase in security, with critical system resources made invisible at execution time. Secondly, containerisation allows processes to execute in environments that are different from the host system; for instance, a particular process that requires a specific library unavailable in the host system may be executed in such a way. What is more, the same process can be made available to execute in different environments, complying with different requirements. This extension is to be included in a forthcoming minor version of PyWPS 4.
Comparison with other WPS servers
GeoServer
GeoServer started as the reference implementation of the WFS standard on the Java programming language [23]. It soon evolved to support most of the other OGC web service standards, including WPS. Today, GeoServer presents itself as a broad platform for geo–spatial data sharing and editing over the internet. It is implemented as a Java servlet, therefore meant to be deployed to application servers such as Tomcat [24] or Jetty [25]. Properly setting up and managing one of these servers demands a certain degree of know–how, even in a development environment.
GeoServer stands out for the way it extends the WPS standard with additional operations and information elements in response documents. This server provided its own operation to stop running process already with WPS version 1.0. Called Dismiss, this operation is in all similar to the Cancel operation in version 2.0 of the standard. Response documents are extended with pagination and an additional parameter named OrderBy which can be used to order the document by owner, identifier or status. The statusInfo document in particular, is extended with three extra elements that detail execution progress:
-
ExpirationDate – date and time by which the process execution and its results will no longer be accessible.
-
EstimatedCompleted – date and time by which the process execution is expected to be finished.
-
NextPoll – suggested time of status update.
Another aspect in which GeoServer excels is in the number of example processes it makes available out of the box. By version 2.13, GeoServer was bundling 192 processes, most of which implementing the spatial functions provided by the JTS Topology Suite [26] (e.g. area, buffer, intersection). To these add a number of processes specific to Geoserver, such as bounds and re–projection, that connect internally to assets served through WCS or WFS.
Various tools are required for the development of a new WPS process in GeoServer. Beyond the Java framework itself, command of the Maven project management tool [27] and the Spring web development framework [28] are also necessary. Each new process must be in itself a full fledged Maven project, requiring its specific Maven and Spring configuration files and particular folder structure. Development clearly benefits from being conducted within a well featured, Java–friendly, Integrated Development Environment such as Eclipse [29].
Process development in GeoServer does not benefit from direct integration with any of the wholesale spatial analysis engines, such as GRASS [30] or SAGA [31]. However, the developer may easily access the functionality provided by GeoTools, a Java toolkit for geo–spatial data [32].
GeoServer comes across as a vast and thorough WPS server, with plenty to offer when it comes to features and out–of–the–box processing abilities. GeoServer provides functionality beyond the WPS standard than can be crucial in scaling up and load–balancing services. On the other hand, it requires the mastery of a number of different tools for the most basic level of development. To someone not well versed on object–oriented programming and the Java ecosystem tooling, developing a process for GeoServer can be a challenge. GeoServer therefore stands in stark contrast to PyWPS, with the latter opting for sufficient compliance to the standard, no additional features, and a minimal set of process examples, but the ease of development within a minimalistic WSGI framework like Flask.
ZOO–Project
ZOO–Project is a WPS implementation coded in C, Python and JavaScript. It supports both version 1.0 and 2.0 of the standard. ZOO–Project is presented as a set of four different components, of which the ZOO–Kernel is the actual server. Notably, it also includes a client side library, something unique among WPS implementations. The full list of components:
-
ZOO–Kernel – a WPS server able to manage and chain WPS services, by loading dynamic libraries and code written in different languages.
-
ZOO–Services – A growing collection of ready to use process built on top of open source libraries such as GDAL [33], GRASS, Orfeo Toolbox [34] or SAGA.
-
ZOO–API – A server–side JavaScript API for creating, chaining and orchestrating WPS Services.
-
ZOO–Client – A client side JavaScript API to interact with WPS servers from web applications.
ZOO–Project is itself a web server, with its core developed in C, making use of the cgic library for CGI programming [35]. This aspect greatly limits dependencies on third–party software, making install and deployment relatively simple (especially when compared with GeoServer). However, it still requires compiling the cgic library and the ZOO–Kernel. Packaged versions are available for operating systems that ship with package managers, but in such cases the user is not able to fine tune compilation parameters. Basic configuration of the ZOO–Project is on par with that of PyWPS, based on a simple text file. But complexity increases as additional components, like Orfeo Toolbox or SAGA, are integrated with the ZOO–Kernel.
Process development is also low on complexity, being essentially based on an abstraction layer that bridges the ZOO–Kernel with the process itself. This abstraction is nothing more than a configuration file with the extension .zcfg that describes to the ZOO–Kernel the process inputs, outputs and other meta–data required in a reply to the WPS DescribeProcess request. While the configuration file is a fairly simple concept, it represents an extra burden compared to pure object–oriented implementations like PyWPS or GeoServer. Names of inputs and outputs are replicated between the source code and the .zcfg file, and must be manually maintained in synchronicity by the process developer.
The one aspect where the ZOO–Project stands out from other WPS implementations is the wide range of programming languages in which processes can be developed. The list presently includes:
-
C – the process is implemented as a shared library;
-
Fortran – the process is a module;
-
Python – the process is a Python module;
-
Java – the process is a Java class;
-
PHP – the process is a script;
-
Ruby – the process is a class;
-
C# – the process is a C# class;
-
JavaScript – the process is a script;
If GeoServer is pretty much at the antipodes of PyWPS considering the functionality/complexity balance, ZOO–Project is found somewhere in between. ZOO–Project excels primarily for its flexibility, it may be used in a lightweight mode, with a basic ZOO–Kernel deployment and simple processes coded in a language like JavaScript; but through increasingly refined configuration, it can also be hiked to integrate with geo–spatial engines and serve processes relying on heavyweight libraries. All this in a bespoke set–up that may best suit user requirements and affinities.
PyWPS use cases
Computation services at DKRZ
The German Climate Computing Centre (Deutsches Klimarechenzentrum, DKRZ) is a central service centre for German climate and earth system research. Its high performance computers, data storage and services form the central research infrastructure for simulation–based climate science in Germany. The DKRZ also hosts a multi–petabyte repository of climate data that can be accessed through the WWW.
Increasing numbers of users call for the provisioning of web based interfaces to compute the data resources hosted by DKRZ. The DKRZ thus participates in national and international joint projects and cooperations with the aim of providing compute services for climate data. In this context, PyWPS has been used to implement and deploy standardised computation services, that can be invoked and orchestrated by users. These activities have led to contributions and active support of the PyWPS and OWSLib projects.
In collaboration with Ouranos (see ahead), the DKRZ started the Birdhouse community effort [36], with the aim of developing auxiliary components for WPS projects. Birdhouse intends to facilitate the creation and usage of compute services based on PyWPS. Among the features provided, the following can be found:
-
A Cookiecutter template [37], including Dockerfiles, that allows users to create their own PyWPS compute services.
-
An Ansible script [38] to deploy a full–stack PyWPS service.
-
A Python library suitable for Jupyter notebooks [39] to interact with WPS compute services.
Canadian climate service platform
Ouranos is a consortium on regional climatology based in Montréal, whose mission is to support adaptation to climate change [40]. This involves working with engineers, biologists, urban planners and professionals from dozens of different disciplines to understand their climate data needs and provide them with clear, understandable and actionable information. To speed–up and standardize the delivery of climate services to users and facilitate collaborations with academics, Ouranos has been developing with the Centre de Recherche en Informatique de Montréal (CRIM) and the Birdhouse community a climate service platform based on WPS [40]. The platform includes a handful of thematic servers powered by PyWPS, offering tools to search data catalogues, compute climate indices, subset and aggregate climate data, run hydrological models using climate projections and a number of other specialized algorithms. These servers are spun–up as Docker containers and accessed through a proxy handling load–balancing and authorization/authentication to files and services. A high–level WPS client has been developed based on OWSLib to simplify access to those services and provide users with an interface to remote processes that look and feel like normal Python functions.
The long term vision for this platform is to facilitate trans–disciplinary collaborations by packaging state–of–the–art scientific expertise into easily accessible web processes available to non–experts. This includes not only climate algorithms but also impact models driven by weather and climate conditions. Ouranos hopes to partner with similarly minded institutions to build a federation of climate service servers which, through conventions on data and metadata formats, would be inter–operable. This would over time lead to scientists writing complex workflows chaining operations and data from multiple different institutions. Not only could this reduce time spent on tedious low level work, but more importantly, make research outputs by experts easier to discover and access by non–specialists.
ECOPOTENTIAL
Environment Systems is an environmental and agricultural data driven consultancy established in 2003 in the UK, specialising in Geo–Informatics and Earth Observation. This consultancy has been researching the potential of wrapping some of its satellite data processing algorithms in WPS processes, within the ECOPOTENTIAL project [41].
ECOPOTENTIAL is a large European project funded by the Horizon 2020 research programme of the European Commission [42]. It focuses its activities on a targeted set of internationally recognised protected areas, blending earth observations from remote sensing and field measurements, data analysis and modelling of current and future ecosystem conditions and services, ready for operational delivery. ECOPOTENTIAL considers cross–scale geosphere–biosphere interactions at regional to continental scales, addressing long–term and large–scale environmental and ecological challenges.
Environment Systems already provides analysis ready satellite data through its data services platform; the research has thus been centred on potential WPS servers that could wrap those services. Different implementations have been assessed, considering three essential aspects: (i) ease of use, (ii) interoperability with other services such as WCS or WFS, and (iii) integration with Celery [43] for scaling. The latter in particular has proved challenging, since it has not yet been possible to run Celery on Python 3.6. At present a series of synchronous WPS services are being developed, that will soon be available at the Environment Systems’ demonstrator site [44]. Even though a specific WPS server implementation is yet to be definitely selected, Environment Systems has built strong experience on PyWPS and contributed back to the project.
Data quality assessment at WOUDC
WOUDC is since 1962 the World Ozone and Ultraviolet Data Centre component of the World Meteorological Organisation (WMO)’s Global Atmospheric Watch. The WOUDC data centre is operated by the Meteorological Service of Canada, a branch of Environment and Climate Change Canada. Its data archive includes total column and vertical profile measurements of Ozone obtained through LiDAR, ozone–sonde flights, and the Umkehr technique. The archive further comprises Ultraviolet (UV) radiation measurements, including high resolution spectra. There are over 500 registered stations in the archive, contributed by more than 150 different institutions.
The WOUDC provides an online data archive, together with metadata (e.g. station location), and value added products such as graphs of total ozone time series and near real–time ozone maps. OGC standards are employed to provide standards–based–on–demand access to the archive.
In 2015 the project was renewed with a focus on data access using standards [45]. This refocus targeted not only data services, but also internal processes. The WOUDC must process, quality access and ingest into its archive the Ozone and UV datasets provided by contributing institutions. The data rejected is reported back to the contributor for subsequent correction and re–submission. WPS was employed to facilitate these procedures.
In 2016 the WOUDC deployed a PyWPS stack to expose services to process and assess data to the public via WPS. This allows contributors to quality assess their data before submitting to the WOUDC. These PyWPS services not only help reduce the internal quality assessment workload, but further provide a means of real–time data validation [46]. The functioning of each of these services is documented in detail to facilitate their use [47].
The earth observation monitor
The Earth Observation Monitor (EOM) aims to ensure easy access and analysis of spatial time–series data for land monitoring on local scales. The concept behind EOM combines the advantages of web service–based geo–processing with easy–to–use interfaces; this provides an easy access for users without specific knowledge in data processing techniques. EOM focuses on hiding existing barriers (e.g., manual data download, (pre–)processing, data conversion), through automation. This enables users can focus on the analysis and interpretation of results.
The back–end system processes Earth observation time–series data and executes analysis tools based on users’ inputs. The basis for the automated data processing and analysis is operational and automated data access, which is accomplished by introducing a multi–source data processing middleware [48]. This middleware is connected to external data providers to interoperate with requested data, including the provision of standardised OGC web services. Data processing and analysis have been made available via WPS services, implemented on PyWPS. Ready–to–use Python libraries, such as rpy2 for the R statistical language [49], as well as command line executions (with the Python library subprocess [50]), are used to run external software for data analysis and data processing.
Since the functions of the EOM are available through web services, client applications can easily interact with it. Two example clients were created to show the possibilities of such a service–based infrastructure: A web portal (webEOM) and a mobile application (mobileEOM). Both of these clients use the OGC WPS–compliant web services developed for data integration and analysis; webEOM uses the OGC Web Map Services and Web Feature Services to visualize the outputs of analysed areas.
The focus of the web portal (Fig. 2) is to provide an easy–to–use client, while making it possible to extract time–series data and execute further time–series analysis functions. At least two inputs are necessary to extract datasets for a given geometry: (1) the location of the area of interest, which can be created in the map as a point or a polygon, and (2) the name of the dataset the user is interested in (e.g., vegetation index, land surface temperature, climate station data). When using the data integration process, users can specify different parameters for the selected dataset, such as start and end dates, as well as filtering options. In addition to the extracted dataset, a time–series and a decomposition plot are generated automatically. (e.g., breakpoint detection, trend calculation). The resulting data can either be visualised directly in the web portal or can be downloaded for further usage. Spatial outputs can be interactively explored on the map, and CSV files are plotted as an interactive chart.

The webEOM portal
During fieldwork, users cannot use web–based systems developed for desktop computers. A mobile application is therefore needed to foster the use of spatial time–series tools on mobile devices, which can be more easily used in the field. The mobile application for EOM was developed to provide access to time–series data and derived analyses on mobile devices. Using their current GPS location or a manual set position, users can extract vegetation time–series data, as well as view data plots, trend, and breakpoint analysis plots directly on their mobile devices. An OGC WPS process was developed for the mobile application, providing all necessary functionalities in a single process, available as a web service. This process extracts data from Google Earth Engine and plots the time–series and decomposition figure. In a second step, time–series analyses for breakpoint detection and trend calculations are executed and plotted in a figure. The resulting output is a GeoJSON file containing the values of the analysis tools, as well as links to the generated figures.
Summary and future developments
PyWPS 4 represents a major step forwards relative to previous versions of the software, embracing state–of–the–art technologies available to the Python language. It preserves much of its original nature, especially the ease of development and simplicity of deployment. Now as a pure Python library, PyWPS offers further degrees of freedom to users and software administrators, making it simple to combine it with different web serving technologies.
While remaining a simple tool to publish processing services to the WWW, the new implementation of PyWPS has opened the way to various advanced features that improve management, deployment and security. With the introduction of an ORM layer, an additional logging mode became available, that greatly enhances log parsing and search. By adopting WSGI PyWPS 4 gained deployment flexibility, easily integrating with different WGSI application frameworks and HTTP engines. This new character renders PyWPS 4 an easy target for containerisation with a technology like Docker. Containerisation improves encapsulation and scalability, and offers new possibilities concerning execution security.
Other WPS implementations exist beyond PyWPS, two projects in particular deserve consideration, since they too are graduated by OSGeo: GeoServer and ZOO–Project. GeoServer is notable by the number of features it offers, even going beyond the WPS standard. ZOO–Project shines with its modularity and the wide range of programming languages and environments it allows. PyWPS offers some important contrasts to those projects, by prising ease of use over feature set, and narrowing development to Python. The philosophy of simplicity has not hindered the adoption of PyWPS, as it can be found in production environments deployed by high–profile institutions around the world.
The work with ORM has opened other development roads for PyWPS, that allow users to rely further on a relational database, if so needed. As part of the 2018 Google Summer of Code, a student of the Czech Technical University in Prague, extended PyWPS with the possibility of storing process outputs directly in a database [51]. Once stored in the database, the outputs are then automatically published through MapServer [52], thus becoming accessible through the appropriate OGC standard (WFS or WCS). This extension is currently under evaluation, and could be integrated formally into PyWPS.
In a coming release of PyWPS (likely a minor version) the development team also intends to introduce logging from user processes to a database. This feature will introduce at least one more additional table to store messages issued from processes in execution.
The major mid–term goal is compliance to version 2.0 of the WPS standard. This newer version introduced three new important requests concerning asynchronous execution: Pause, Resume and Cancel. The former two serve to temporary halt (and later resume) execution of a process, the latter terminates processing execution altogether, abandoning any outputs. While Cancel appears implementable without much re–design, the same is not true for Pause and Resume. PyWPS relies on Multiprocessing for asynchronous process execution, which does not support message passing, or any other formal process–to–process interaction mechanism, therefore an alternative must be conceived. The development team has been considering Celery for this purpose, even though it might be a somewhat heavy solution. An alternative would be to further extend the process containerisation paradigm, applying these new WPS requests to container images in which processes are executed. In any event, full compliance with WPS 2.0 is certain to require a relevant review of the PyWPS 4.0 design, therefore being something to expect only with a future major release.
Availability and requirements
-
Project name: PyWPS
-
Project home page: https://www.pywps.org
-
Operating system(s): Platform independent
-
Programming language: Python
-
Other requirements: PyWPS runs on Python 2.7, 3.3 or higher. Git and the Python bindings for GDAL must be installed in the system. The Python libraries on which PyWPS depends are listed in the file requirements.txt that may be applied with a package manager like pip.
-
Licence: MIT
-
Any restrictions to use by non–academics: only those stated in the licence.
Abbreviations
- CRIM:
-
Centre de Recherche en Informatique de Montréal
- EOM:
-
Earth observation monitor
- OGC:
-
Open geospatial consortium
- ORM:
-
Object–relation mapping
- RPC:
-
Remote procedure call
- WCS:
-
Web coverage service
- WFS:
-
Web feature service
- WMO:
-
World meteorological organisation
- WPS:
-
Web processing service
- WSGI:
-
Web server gateway interface
- WOUDC:
-
World ozone and ultraviolet data centre
- WWW:
-
World wide web
References
Mueller M, Pross B. OGC\(\circledR \)WPS 2.0 Interface Standard Corrigendum 1.
de Jesus J, Walker P. WPS cookbook. Technical report. 2011.
de Sousa L, Eykamp C, Leopold U, Baume O, Braun C. iGUESS - A web based system integrating Urban Energy Planning andAssessment Modelling for multi-scale spatial decision making. In: International Congress on Environmental Modelling and Software Managing Resources of a Limited Planet, Sixth Biennial Meeting. Leipzig: 2012. p. 8. https://doi.org/10.13140/2.1.3913.7284. http://www.iemss.org/sites/iemss2012/proceedings.html http://www.iemss.org/sites/iemss2012/proceedings/A3_0783_Sousa_et_al.pdf.
Čepický J, de Sousa LM. The International Archives of Photogrammetry, Remote Sensing and Spatial Information Sciences. 2016; 41:927.
Free Software Foundation Inc.The MIT License. 1991. https://opensource.org/licenses/GPL-2.0. Accessed 2 June 2019.
Massachusetts Institute of Technology (MIT). The MIT License. 1988. https://opensource.org/licenses/MIT. Accessed 24 Sept 2018.
lxml contributors. lxml - XML and HTML with Python. 2018. https://lxml.de/. Accessed 24 Sept 2018.
Python contributors. multiprocessing — Process-based parallelism. 2018. https://docs.python.org/3.7/library/multiprocessing.html. Accessed 24 Sept 2018.
Kralidis T. OWSLib 0.17.0 documentation. 2018. https://geopython.github.io/OWSLib/. Accessed 24 Sept 2018.
Open Source Geospatial Foundation. Project Graduation Checklist. 2014. https://www.osgeo.org/about/committees/incubation/graduation/. Accessed 8 July 2019.
Open Source Geospatial Foundation. PyWPS graduation sheet. 2018. https://wiki.osgeo.org/wiki/PyWPS. Accessed 5 June 2019.
Copeland R. Essential SQLAlchemy. Sebastopol: O’Reilly Media, Inc.; 2008.
PyWPS Development Team. PyWPS Configuration. 2018; https://pywps.readthedocs.io/en/latest/configuration.html. Accessed 8 Dec 2018.
PyWPS Development Team. Demo service for PyWPS 4 with Flask. 2018. https://github.com/geopython/pywps-flask. Accessed: 8 Dec 2018.
Grinberg M. Flask Web Development: Developing Web Applications with Python. Sebastopol: O’Reilly Media, Inc.; 2014.
PyWPS Development Team. PyWPS demo using django. 2018. https://github.com/jorgejesus/pywps-django. Accessed 8 Dec 2018.
Forcier J, Bissex P, Chun WJ. Python Web Development with Django. Boston: Addison-Wesley Professional; 2008.
Chesneau B, et alia. Gunicorn-Python WSGI HTTP Server for UNIX. 2017. http://gunicorn.org/. Accessed 24 Nov 2017.
Reese W. Nginx: the high-performance web server and reverse proxy. Linux J. 2008; 2008(173):2.
PyWPS Development Team. PyWPS repository at Docker Hub. 2018. https://hub.docker.com/u/pywps/. Accessed 8 Dec 2018.
Merkel D. Docker: lightweight linux containers for consistent development and deployment. Linux J. 2014; 2014(239):2.
Laža A. Izolace procesŭ ve frameworku pywps. Master’s thesis. 2018. https://github.com/ctu-geoforall-lab-projects/dp-laza-2018/.
Open Source Geospatial Foundation. What is Geoserver? 2019. http://geoserver.org/about/. Accessed 3 Mar 2019.
The Apache Software Foundation. Apache Tomcat. 2019. http://tomcat.apache.org/. Accessed 3 Mar 2019.
The Eclipse Foundation. About Eclipse Jetty. 2019. https://www.eclipse.org/jetty/about.html Accessed 3 Mar 2019.
JTS Contributors. JTS Topology Suite. 2019. https://sourceforge.net/projects/jts-topo-suite/. Accessed 2 Mar 2019.
The Apache Software Foundation. The Apache Maven Project. 2019. https://maven.apache.org/. Accessed 2 Mar 2019.
Pivotal Software Inc. Spring: the source for modern java. 2019. https://spring.io/. Accessed 2 Mar 2019.
The Eclipse Foundation. Eclipse: The Platform for Open Innovation and Collaboration. 2019. https://www.eclipse.org/. Accessed 2 Mar 2019.
GRASS Development Team. GRASS – Geographic Resources Analysis Support System. 2019. https://grass.osgeo.org/. Accessed 3 Mar 2019.
SAGA contributors. SAGA – System for Automated Geoscientific Analyses. 2019. http://www.saga-gis.org. Accessed 3 Mar 2019.
Open Source Geospatial Foundation. GeoTools: The Open Source Java GIS Toolkit. 2019. http://geotools.org/. Accessed 3 Mar 2019.
GDAL contributors. GDAL - Geospatial Data Abstraction Library. 2019. https://www.gdal.org/. Accessed 3 Mar 2019.
Centre National d’Études Spatiales (CNES). Orfeo ToolBox – Open Source processing of remote sensing images. 2019. https://www.orfeo-toolbox.org/. Accessed 3 Mar 2019.
Boutell.Com Inc. cgic: an ANSI C library for CGI Programming. 2019. https://boutell.com/cgic/. Accessed 3 Mar 2019.
The Birdhouse Community. The Birdhouse Project: Climate data analytics for sustainable development using OGC standards. 2019; http://bird-house.github.io/. Accessed 24 Feb 2019.
Greenfeld DanielRoyandPierzina Raphael. Cookiecutter: Better Project Templates. 2019. https://cookiecutter.readthedocs.io. Accessed 24 Feb 2019.
Red Hat Inc.Ansible: Automation for everyone. 2019. https://www.ansible.com/. Accessed 24 Feb 2019.
Project Jupyter contributors. The Jupyter Notebook. 2019. https://jupyter.org/. Accessed 24 Feb 2019.
Huard D, Chaumont D, Logan T, Sottile M-F, Brown RD, St-Denis BG, Grenier P, Braun M. A decade of climate scenarios: The ouranos consortium modus operandi. Bull Am Meteorol Soc. 2014; 95(8):1213–25. https://doi.org/10.1175/BAMS-D-12-00163.1. https://doi.org/10.1175/BAMS-D-12-00163.1.
The ECOPOTENTIAL Consortium. ECOPOTENTIAL: improving future ecosystem benefits through earth observations. 2019. http://www.ecopotential-project.eu/. Accessed 24 Feb 2019.
European Commission. What is Horizon 2020? 2019. https://ec.europa.eu/programmes/horizon2020/what-horizon-2020. Accessed 2 June 2019.
Ask Solem and contributors. Celery: Distributed Task Queue. 2019. http://www.celeryproject.org/. Accessed 28 Feb 2019.
Environment Systems Ltd. Environment Systems Data Services Demonstrator. 2019. https://data.envsys.co.uk/demonstrator/. Accessed 24 Feb 2019.
World Ozone and Ultraviolet Radiation Data Centre. 2019. https://woudc.org/about/data-access.php. Accessed 27 Feb 2019.
World Ozone and Ultraviolet Radiation Data Centre. Data Validator. 2019. https://woudc.org/contributors/validation.php. Accessed 27 Feb 2019.
World Ozone and Ultraviolet Radiation Data Centre. Working with WOUDC Web Services. 2019. https://github.com/woudc/woudc/wiki/WebServicesHowto. Accessed 24 Feb 2019.
Eberle J, Clausnitzer S, Hüttich C, Schmullius C. Multi-source data processing middleware for land monitoring within a web-based spatial data infrastructure for siberia. ISPRS Int J Geo-Inform. 2013; 2(3):553–76.
Gautier L. rpy2 - R in Python. 2019. https://rpy2.bitbucket.io/. Accessed 5 Mar 2019.
Python Software Foundation. subprocess — Subprocess management. 2019. https://docs.python.org/3.5/library/subprocess.html. Accessed 5 Mar 2019.
Pisl J. Database Output Storage for PyWPS. 2018. https://wiki.osgeo.org/wiki/Database_Output_Storage_for_PyWPS. Accessed 8 Dec 2018.
Kropla B. Beginning MapServer: Open Source GIS Development. New York: Apress; 2006.
Acknowledgements
The authors would like to thank all individuals that contributed to PyWPS 4, be it with code, bug reports, documentation or mere support, too many to list in this space.
The ECOPOTENTIAL project has received funding from the European Union’s Horizon 2020 research and innovation programme under grant agreement No 641762.
Author information
Authors and Affiliations
Contributions
All authors have contributed actively to the development of PyWPS 4 and its code base. JČ is the original creator of PyWPS, having been involved in all its releases since 2007. TK is since 2015 the project mentor, being largely responsible for its graduation with the OSGeo Foundation. JČ, JMdJ, JE, LMdS and TK are founding members of the PyWPS Project Steering Committee (PSC); CE is a PSC member since 2018. For this article, LMdS lead the writing; JMdJ devised the WSGI set up, developed the Docker images and assessed alternative WPS servers; CE, DH, SB, TK and JE contributed to the accounting of Use Cases; JČcoordinated students’ contribution programmes.
Corresponding author
Ethics declarations
Competing interests
The authors declare that they have no competing interests.
Additional information
Publisher’s Note
Springer Nature remains neutral with regard to jurisdictional claims in published maps and institutional affiliations.
Rights and permissions
Open Access This article is distributed under the terms of the Creative Commons Attribution 4.0 International License (http://creativecommons.org/licenses/by/4.0/), which permits unrestricted use, distribution, and reproduction in any medium, provided you give appropriate credit to the original author(s) and the source, provide a link to the Creative Commons license, and indicate if changes were made.
About this article

Cite this article
de Sousa, L.M., de Jesus, J.M., Čepicky, J. et al. PyWPS: overview, new features in version 4 and existing implementations. Open geospatial data, softw. stand. 4, 13 (2019). https://doi.org/10.1186/s40965-019-0072-0
Received:
Accepted:
Published:
DOI: https://doi.org/10.1186/s40965-019-0072-0